Download
1 / 8
80 likes | 208 Views
https://zoomcharts.com/en/gallery/all:mixed-timechart-columns-area-bitcoin-transactions-gradient Working with a mass amount of data can seem daunting, but the process is becoming increasingly easier with advanced data visualization tools. ZoomCharts’ Time Chart Mixed Columns and Area tool makes it easy to present large amounts of data simply and effectively. Clients from many different fields, including science, medicine, business, law, administration, information technology, transportation, media, marketing, engineering, consulting, education, and more, have unlocked the possibilities of analyzing and using their data with ZoomCharts’ data visualization tools. - Display large amounts of data in one place - Work with mixed data in the same graph or chart - Expand and zoom in and out of data with a simple click or scroll - Filter and display data according to specific time intervals - Export data to open in various file types Step 1 Hover over data items to display detailed information. Step 2 Click on a data item to expand it. Step 3 Sort and display specific types of data using the filters at the top right. Step 4 Zoom in and out of the chart by swiping up or down with your mouse scroll pad, or by using the Zoom-out feature at the top left. Step 5 Go back to the full data display using the Back feature at the top right. ZoomCharts http://www.zoomcharts.com The world’s most interactive data visualization software

E N D
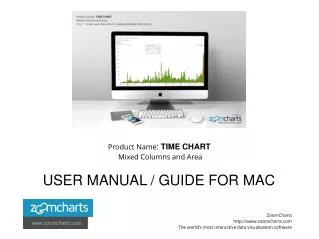
Product Name: TIME CHART Mixed Columns and Area USER MANUAL / GUIDE FOR MAC ZoomCharts http://www.zoomcharts.com The world’s most interactive data visualization software
Product Name: TIME CHART Mixed Columns and Area Working with a mass amount of data can seem daunting, but the process is becoming increasingly easier with advanced data visualization tools. ZoomCharts’ Time Chart Mixed Columns and Area tool makes it easy to present large amounts of data simply and effectively. Clients from many different fields, including science, medicine, business, law, administration, information technology, transportation, media, marketing, engineering, consulting, education, and more, have unlocked the possibilities of analyzing and using their data with ZoomCharts’ data visualization tools. - Display large amounts of data in one place - Work with mixed data in the same graph or chart - Expand and zoom in and out of data with a simple click or scroll - Filter and display data according to specific time intervals - Export data to open in various file types ZoomCharts http://www.zoomcharts.com The world’s most interactive data visualization software
https://zoomcharts.com/en/gallery/all:mixed-timechart-columns-area-bitcoin-transactions-gradienthttps://zoomcharts.com/en/gallery/all:mixed-timechart-columns-area-bitcoin-transactions-gradient ZoomCharts http://www.zoomcharts.com The world’s most interactive data visualization software
https://zoomcharts.com/en/gallery/all:mixed-timechart-columns-area-bitcoin-transactions-gradienthttps://zoomcharts.com/en/gallery/all:mixed-timechart-columns-area-bitcoin-transactions-gradient ZoomCharts http://www.zoomcharts.com The world’s most interactive data visualization software
https://zoomcharts.com/en/gallery/all:mixed-timechart-columns-area-bitcoin-transactions-gradienthttps://zoomcharts.com/en/gallery/all:mixed-timechart-columns-area-bitcoin-transactions-gradient ZoomCharts http://www.zoomcharts.com The world’s most interactive data visualization software
https://zoomcharts.com/en/gallery/all:mixed-timechart-columns-area-bitcoin-transactions-gradienthttps://zoomcharts.com/en/gallery/all:mixed-timechart-columns-area-bitcoin-transactions-gradient ZoomCharts http://www.zoomcharts.com The world’s most interactive data visualization software
https://zoomcharts.com/en/gallery/all:mixed-timechart-columns-area-bitcoin-transactions-gradienthttps://zoomcharts.com/en/gallery/all:mixed-timechart-columns-area-bitcoin-transactions-gradient ZoomCharts http://www.zoomcharts.com The world’s most interactive data visualization software
ZoomCharts http://www.zoomcharts.com The world’s most interactive data visualization software