Download
1 / 23
230 likes | 380 Views
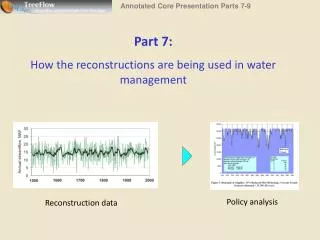
Annotated Core Presentation Parts 7-9. Part 7: How the reconstructions are being used in water management. Policy analysis. Reconstruction data. Applications of the reconstructions – three main types. As qualitative guidance for water managers, stakeholders and decisionmakers

E N D
Annotated Core Presentation Parts 7-9 Part 7: How the reconstructions are being used in water management Policy analysis Reconstruction data
Applications of the reconstructions – three main types • As qualitative guidance for water managers, stakeholders and decisionmakers • For quantitative assessments of long-term hydrologic variability • For example, assessing the frequency of a recent drought event in the gage record in the context of the longer reconstruction • As direct inputs into hydrologic models of a water system • This allows water managers to model system performance under the tree-ring reconstructed hydrology, as they would do with the gaged hydrology • Use of the tree-ring data in a water model usually requires further processing of the data (e.g., time-disaggregation)
1) As qualitative guidance for water managers, stakeholders and decisionmakers • Example: Tri-fold brochure developed for Rio Grande Water Conservation District to educate water users about long-term variability in water supply
2) For quantitative assessments of long-term hydrologic variability Example: Analysis of lowest mean reconstructed flows for n-length droughts, Boulder Creek, 1566-2002 Graphic by Lee Rozaklis, AMEC Earth and Environnmental
(3) Input into a system model, to assess management scenarios Example: Salt River Project (SRP), AZ. Test of an allotment/pumping strategy • SRP recognized that the 1950s design drought (6 years) was shorter than the worst expected future droughts • An 11-year reconstructed drought in the Salt-Verde-Tonto basin (1575-1585) was used to test SRP’s current allotment and pumping strategy • A simple model, using annual inflows, was used
Salt River Project: test of allotment/pumping strategy • The 11-year drought reduced reservoir storage to zero in year 11 (blue) • A slight change in the allotment/pumping scenario increased it above zero (green)
Example: Denver Water: supplemental approach to water supply yield analyses • Standard approach uses only a 45-year period (1947-1991), and the design drought (1953-1956) probably doesn’t represent a true worst-case scenario • So this supplemental approach uses two tree-ring flow reconstructions for the main supply basins (common period: 1634-2002) • However, Denver Water’s system model (PACSM) requires daily model input from 450 locations • So an “analogue year” approach was used which matches each year in the reconstructed flows with one of the 45 model years (1947-1991) with known hydrology and use that year’s daily hydrology
Denver Water: water supply yield analyses Reservoir contents with 345 KAF demand and progressive drought restrictions • Two paleo-droughts (1680s, 1840s) deplete contents lower than 1950s design drought
Example: Bureau of Reclamation: analyses for Colorado River Shortage EIS • Appendix N • Analyses of Hydrologic Variability Sensitivity • “…to evaluate the potential effects to the hydrologic resources of alternative hydrologic inflow sequences.” • Alternative hydrologies: • Two hydrologies based on tree-ring reconstructions of Lees Ferry flow • Block resampling of observed flow • Stochastic manipulation of observed flow
Flowchart of paleohydrologic analyses Tree-ring reconstruction of annual streamflow at Lees Ferry “Paleo-Conditioned” “Direct Paleo” Convert to binary (wet-dry), calculate transition probabilities Block resample paleo record, retaining paleo flow magnitudes Nonhomogeneous Markov model with kernel smoothing to generate system state Generate paleo-flow conditionally (K-NN resampling of observed flow) Non-parametric spatial and temporal disaggregation into monthly flows at 29 model nodes Input into CRSS for policy analyses Adapted from Jim Prairie, Reclamation
Model output from Reclamation “Shortage” EIS, 2007 “Direct Paleo” sequence based on Meko et al. Lees Ferry reconstruction Modeled Lake Powell (orange) and Lake Mead (green) year-end elevations under No Action (dashed) and Preferred Alternative (solid) No power from Powell
Who’s using tree-ring reconstructions? (a partial list) • Colorado • New Mexico • Arizona • California • Nevada • Multi-state • Denver Water • Colorado Water Conservation Board • Northern Colorado Water Conservancy District • Colorado River Water Conservation District • Rio Grande Water Conservation District • U.S. Bureau of Reclamation – Aspinall Unit • City of Boulder • City of Westminster • New Mexico Interstate Stream Commission • Salt River Project (Phoenix) • City of Chandler • California Department of Water Resources • Southern Nevada Water Authority • U.S. Bureau of Reclamation - Lower Colorado
Responses about use of tree-ring data, from Web survey of tree-ring workshop participants in 2008 (n = 30) from Rice et al, in review
Part 8: How the reconstructions are relevant in a changing climate
Even as humans exert a stronger influence on climate, this influence will still be superimposed on natural variability • There is no reason to think that the range of natural hydrologic variability, particularly periods of drought, documented in the past will not be repeated in the future • The difference will be that events such as drought will likely occur under warmer conditions. • Although projected changes in precipitation are still uncertain in many area, especially in mountain watershed, projections for temperature are robust. • Using the reconstructed flows, rather than just the observed record, as the frame of reference for planning can lead to fewer “surprises” as we head into a climatically uncertain future
Adding warming to the natural flow variability seen in the reconstructions can provide useful scenarios for the future • One can assume a future warming (e.g, 2 degrees C) and run a hydrologic model to estimate the reduction in flow from that warming, then adjust the reconstructed flows accordingly • Or, output of projected Temperature and Precipitation from Global Climate Models (GCMs) can be combined with information from flow reconstructions using several different techniques, to generate future-climate-perturbed hydrology • Either way, the resulting hydrology reflects the joint risk of natural climate variability (as seen in the tree-ring data) and future climate change
Example: Integration of tree-ring reconstructed flows with GCM projections - City of Boulder, CO (with Stratus Consulting, University of Colorado, AMEC Earth & Environmental, and NOAA) • Disaggregated the annual reconstructed streamflows into monthly precipitation and temperature so that those variables could be manipulated independently • Changes in temperature and precipitation projected from climate models are combined with the tree-ring-derived data to produce simulations of past hydrology under plausible future climate conditions • Then the simulated monthly temperature and precipitation were input into a snowmelt-runoff (SRM) and water-balance (WATBAL) model to produce modeled Boulder Creek flows • see Southwest Hydrology, Jan/Feb 2007 for an overview • Final project report released February 2009
Example: Integration of tree-ring reconstructed flows with GCM projections – City of Boulder, CO Worst case scenario: A “dry” GCM projection imposed on the reconstruction (blue bar = modeled reduction in water delivery) Lee Rozaklis, AMEC Earth and Environmental
Combining climate projections with tree-ring reconstructions - other applications and references • US Bureau of Reclamation: “Long-Term Planning Hydrology based on Various Blends of Instrumental Records, Paleoclimate, and Projected Climate Information” • Study which evaluated combinations of reconstructions and climate model output for the Gunnison (CO) and Upper Missouri (WY, MT) • review report released April 2009 • State of Colorado Water Conservation Board – Colorado River Water Availability Study • Future streamflow scenarois combine paleohydrology with climate projections • “Climate Change and Water Resources Management: A Federal Perspective” – report by USGS and other agencies (Brekke et al. 2009) • p. 19: “Paleoclimate information…can be useful for developing climate scenarios that include a wide range of potential hydroclimatic conditions.”
Part 9: Summary and the TreeFlow web resource
Summary, Part I 1) Tree-ring reconstructions are valuable in that they provide much more “hydrologic experience” than the observed hydrology 2) Tree growth can be particularly sensitive to variations in moisture availability and thus streamflow 3) The methods to develop tree-ring chronologies and streamflow reconstructions are designed to robustly capture and enhance this moisture signal 4) A reconstruction is a best-estimate based on the relationship between tree-growth and gaged flows; there is always uncertainty in the reconstructed flows
Summary, Part II • 5) The reconstructions show greater variability than the observed record, including drought events more severe and sustained • 6) Reconstructions can be used in a number of different ways to provide guidance to water managers and decision-makers • 7) Reconstructions can be combined with projections from climate models to provide plausible scenarios for future hydrology • 8) For more information, and easy access to reconstruction data, please visit the TreeFlow web resource: • http://treeflow.info
The TreeFlow web resource - http://treeflow.info • User-friendly, direct, and basin-organized data access for the western US • Data Access PLUS • Instructional materials • Applications information • Workshop archives • Analysis tools