Download
1 / 1
10 likes | 127 Views
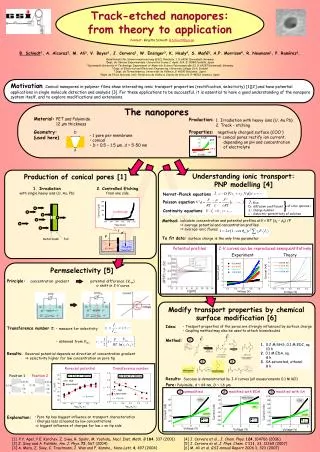
Position 1. 200. 150. Current (pA). 100. 50. breakthrough. 0. 242. 244. 246. 248. 250. 252. Time (min). Position 2. D. I (nA). 12. pH 7. 8. pH 5. 4. pH 2. d. - 400. 400. U (mV). : flux D i : diffusion coefficient z i : charge number

E N D
Position 1 200 150 Current (pA) 100 50 breakthrough 0 242 244 246 248 250 252 Time (min) Position 2 D I(nA) 12 pH 7 8 pH 5 4 pH 2 d - 400 400 U(mV) : flux Di: diffusion coefficient zi : charge number e : dielectric permittivity of solution of ionic species i Continuity equations asymmetric etching metal mask foil I V stopping solution etchant Transference number t: • measure for selectivity • obtained from Vrev Explanation: • Pore tip has biggest influence on transport characteristics • Charges less screened by low concentrations • biggest influence of charges for low c on tip side Track-etched nanopores: from theory to application Contact: Birgitta Schiedt: B.Schiedt@gsi.de B. Schiedt1, A. Alcaraz2, M. Ali3, V. Bayer1, J. Cervera2, W. Ensinger3, K. Healy4,S. Mafé5,A.P. Morrison4,R. Neumann1, P. Ramírez6, 1Gesellschaft für Schwerionenforschung (GSI), Planckstr. 1, D-64291 Darmstadt, Germany 2Dept. de Ciències Experimentals. Universitat Jaume I. Apdo. 224, E-12080 Castelló, Spain 3 Darmstadt University of Technology, Department of Materials Science Petersenstraße 23, D-64287 Darmstadt, Germany 4 Dept. of Electrical and Electronic Engineering, University College Cork, Ireland 5 Dept. de Termodinàmica, Universitat de València, E-46100 Burjassot, Spain 6Dept. de Física Aplicada. Univ. Politècnica de València. Camino de Vera s/n, E-46022 Valencia, Spain Motivation Conical nanopores in polymer films show interesting ionic transport properties (rectification, selectivity) [1][2] and have potential applications in single molecule detection and analysis [3]. For these applications to be successful, it is essential to have a good understanding of the nanopore system itself, and to explore modifications and extensions. The nanopores Material:PET and Polyimide 12 µm thickness Production: • Irradiation with heavy ions (U, Au Pb) • Track - etching Geometry: (used here) Properties: negatively charged surface (COO-) a conical pores rectify ion current, depending on pH and concentration of electrolyte • 1 pore per membrane • conical • D = 0.5 – 1.5 µm, d = 5-50 nm Understanding ionic transport: PNP modelling [4] Production of conical pores [1] 1. Irradiation with single heavy ions (U, Au, Pb) 2.Controlled Etching from one side Nernst-Planck equations Poisson equation Method: calculate concentration and potential profiles atVRT (fL – fR) /F a average potential and concentration profiles a average ionic fluxes To fit data: surface charge is the only free parameter I-V curves can be reproduced semiquantitatively Potential profiles Experiment Theory Permselectivity [5] Principle: concentrationgradient potential difference(Vrev) shift in I-V curve Modify transport properties by chemical surface modification [6] • Trasport properties of the pores are strongly influenced by surface charge • Coupling method may also be used to attach biomolecules Idea: Method: 1 1. 0.2 M NHS, 0.1 M EDC, aq. 10 h 2. 0.1 M EDA, aq. 8 h 3. SA saturated, ethanol 8 h Results: Reversal potential depends on direction of concentration gradient selectivity higher for low concentration on pore tip 2 3 Reversal potential Transference number Results: Success is demonstrated by I-V curves (all measurements 0.1 M KCl) PNP experiment Pore: Polyimide, d ~ 64 nm, D ~ 1.6 µm PNP unmodified modified with EDA modified with SA 1 2 3 experiment -NH3+/COO- -COO- -COO- -NH3+ -COOH -COOH [1] P.Y. Apel, Y.E. Korchev, Z. Siwy, R. Spohr, M. Yoshida,Nucl. Inst. Meth. B184, 337 (2001) [2] Z. Siwy and A. Fuliński, Am. J. Phys.72, 567 (2004) [3] A. Mara, Z. Siwy, C. Trautmann, J. Wan and F. Kamme, Nano Lett.4, 497 (2004) [4] J. Cervera et al., J. Chem. Phys.124, 104706 (2006) [5] J. Cervera et al.,J. Phys. Chem. C111, 33, 12265 (2007) [6] M. Ali et al. GSI Annual Report20061, 323 (2007)