Download
1 / 39
390 likes | 480 Views
Learn how to create attractive and readable documents using columns, tables, and graphics in Word 2007. Improve document appearance and readability with step-by-step instructions on formatting columns, inserting tables, and manipulating Clip Art, SmartArt, and WordArt.

E N D
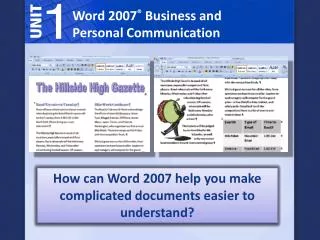
Word 2007® Business and Personal Communication How can Word 2007 help you make complicated documents easier to understand?
Lesson 5: Columns, Tables, and Graphics Use Word 2007 to create columns, tables, and graphics to improve the appearance and readability of lengthy documents. Table SmartArt
Lesson 5: Columns, Tables, and Graphics View This Presentation to Answer the Following Questions: • How can I create and format columns? • How can I insert and modify a table? • How can I insert and manipulate Clip Art, SmartArt, and WordArt? • How can I work with a text box? • What vocabulary words should I review?
Lesson 5: Columns, Tables, and Graphics Columns, tables, and graphics can make a document like a newsletter more attractive and easy to read. A column groups text vertically and makes it easier to read many stories on a single page. Newsletter text is usually displayed in two or three columns.
Lesson 5: Columns, Tables, and Graphics To create columns in a document, use the Columns dialog box. This dialog box allows you to control how the columns are formatted.
Lesson 5: Columns, Tables, and Graphics Presets allow you to select preformatted columns Use the Columns dialog box to adjust column width, or by change t he number of columns. To see what your columns will look like, choose Preview.
Lesson 5: Columns, Tables, and Graphics When text reaches the end of a column, it automatically wraps, or moves, to the top of the next column. Insert a column break to force text to begin at the top of the next column by clicking the Breaks button on the Page Layout tab.
Lesson 5: Columns, Tables, and Graphics Academic Skills Check How do you format a newsletter so that it is attractive and easy to read? Answer: Formatting a newsletter in columns makes it attractive and easy to read.
Lesson 5: Columns, Tables, and Graphics Tech Check How do you adjust the width of columns in a Word document? Answer: Use the Columns dialog box to adjust the width of columns in a Word document.
Lesson 5: Columns, Tables, and Graphics Tables effectively present complicated information. At work, you might use a table to present the results of a survey or a detailed analysis of information. At school, you might use a table to list the research results for a science project.
Lesson 5: Columns, Tables, and Graphics Use the Insert Table dialog box, to choose the number of columns and rows in your table. To insert or draw a table in a document, click the Table button on the Insert tab.
Lesson 5: Columns, Tables, and Graphics A table consists of vertical columns and horizontal rows. Cell Row When columns and rows cross in a table, they form a cell. Column
Lesson 5: Columns, Tables, and Graphics To key text in a cell, position the insertion point in the cell and then start keying text. Page Up Page Down To move more efficiently through cells, rows, and columns, use keyboard shortcuts .
Lesson 5: Columns, Tables, and Graphics Add shading and borders to emphasize specific content and make a table look more interesting. To make text fit better, change column widths, or let AutoFit do it for you.
Lesson 5: Columns, Tables, and Graphics To add borders and shading to a table, click the Borders and Shading drop-down arrows on the Home tab. To format the borders and shading of a table, use the Borders and Shading dialog box.
Lesson 5: Columns, Tables, and Graphics Academic Skills Check How might you use a table in a professional document? Answer: You might use a table to present the results of a survey or a detailed analysis of information collected.
Lesson 5: Columns, Tables, and Graphics Academic Skills Check How do you insert a table in a Word document? Answer: To insert or draw a table in a Word document, click the Table button on the Insert tab.
Lesson 5: Columns, Tables, and Graphics You can use Word 2007 to insert and manipulate Clip Art. Use Clip Art to enhance the look of a document and break up long blocks of text. Clip Art
Lesson 5: Columns, Tables, and Graphics The Clip Art Gallery contains pictures that you can insert into a document.
Lesson 5: Columns, Tables, and Graphics To resize and format Clip Art to fit your document’s design, use the Advanced Layout dialog box. To move Clip Art, point to it and drag it to where you want to place it on the page.
Lesson 5: Columns, Tables, and Graphics Use text boxes to arrange individual blocks of text on a page. A text box is a movable, resizable box that contains text.
Lesson 5: Columns, Tables, and Graphics Use a sizing handle to resize a text box. Sizing handles can also be used to resize objects, such as Clip Art and pictures.
Lesson 5: Columns, Tables, and Graphics The SmartArt Gallery contains several samples of diagrams to help you make your point. A diagram can explain an idea or process by displaying it graphically. Diagram
Lesson 5: Columns, Tables, and Graphics A graphic is an element that is used to display information and add visual interest to a document. Graphic Word has tools that allow you to create an easy-to-see graphic shape such as a circle, arrow, or star.
Lesson 5: Columns, Tables, and Graphics Use the Shapes menu to select the type of shape you want to create and use.
Lesson 5: Columns, Tables, and Graphics stretched, WordArt is text that is… shadowed, or shaped. The WordArt Gallery contains many different types of WordArt.
Lesson 5: Columns, Tables, and Graphics WordArt creates visual interest and appeal in documents. Use WordArt to create a visually appealing title for a newsletter.
Lesson 5: Columns, Tables, and Graphics Academic Skills Check What are some ways of creating visual interest in a newsletter? Answers include: Some ways of creating visual interest in a newsletter include adding graphics such as Clip Art, SmartArt, and WordArt.
Lesson 5: Columns, Tables, and Graphics TechCheck How do you resize and format Clip Art to fit a document’s design? Answer: Use the Advanced Layout dialog box to resize and format Clip Art to fit a document’s design.
Lesson 5: Columns, Tables, and Graphics TechCheck How do you resize a text box? Answer: Use the sizing handles to resize a text box.
Lesson 5: Columns, Tables, and Graphics Vocabulary Review column All of the cells arranged vertically under a lettered column heading.
Lesson 5: Columns, Tables, and Graphics Vocabulary Review column break Separation of text from one column to the top of the next column.
Lesson 5: Columns, Tables, and Graphics Vocabulary Review table A set of rows and columns used to organize information.
Lesson 5: Columns, Tables, and Graphics Vocabulary Review cell The intersection of a row and a column in a table or worksheet.
Lesson 5: Columns, Tables, and Graphics Vocabulary Review Clip Art Moveable and resizable images or pre-made graphics that can be inserted into a document to break up long blocks of text
Lesson 5: Columns, Tables, and Graphics Vocabulary Review text box A moveable, resizable rectangle that contains text.
Lesson 5: Columns, Tables, and Graphics Vocabulary Review diagram A graphic that represents or illustrates a concept or process. Diagrams can be used to organize and present information visually.
Lesson 5: Columns, Tables, and Graphics Vocabulary Review graphic A visual element that is used to display information and add visual interest to a document.
Lesson 5: Columns, Tables, and Graphics Vocabulary Review WordArt A tool used to create text that is stretched, shadowed, or shaped.