Download
1 / 20
200 likes | 355 Views
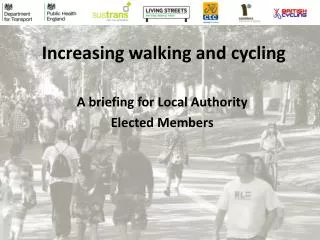
Monitoring and evaluation of walking and cycling interventions in Scotland. Andy Cope Director, Research and Monitoring Unit Sustrans. 1. Context. Sustrans in Scotland… National Cycle Network Connect2 Active Travel School Travel Liveable Neighbourhoods …

E N D
Monitoring and evaluation of walking and cycling interventions in Scotland Andy CopeDirector, Research and Monitoring UnitSustrans
1. Context Sustrans in Scotland… • National Cycle Network • Connect2 • Active Travel • School Travel • Liveable Neighbourhoods • … • £3.5m in 2009/10 from Scottish Government
2. KPI ‘sets’ Five distinct areas… • Engineering • Education • Encouragement • Enforcement and compliance • Evaluation
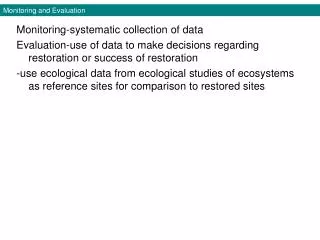
3. Evaluation KPIs Three distinct areas… • Changes in usage on the National Cycle Network and other local cycling and walking networks • Community and wider benefits • Process monitoring
4. Changes in usage on the NCN and other local cycling and walking networks Five distinct indicators/targets… • Trips on the NCN and NCN links increase 15% • Of 15% increase in trips, 25% will be new users • Increase usage on short links by 10% • Increase commuting trips on the NCN by 15% • 10% increase in active travel in intervention locations
5. Data generated: cycle count data The resource consists of: • Over 150 cycle counters that we know about • Data from 34 analysed • Non-parametric slope estimators
5. Data generated: cycle count data Average change in the average daily count over a one year period = 13%
6. Data generated: Route User Survey Weaknesses… • practical • sampling • statistical power • validation • translational But the strengths are replicability, deliverability, growing body of consistent evidence, increasingly robust in delivery context, useful as evidence
7. KPI example: trips on the NCN • Several distinct indicators • 20 counters show +6.3% per annum • [+1.3% at 14 non NCN sites; +4.5% across all sites] • NCN usage increased from 28.3 million trips in 2007 to 31.3 million trips in 2008, a +10.6% increase • Positive case studies, e.g. +240% pedestrian usage increase at Dumbarton
8. Scotland Hands-Up Context • Annual hands-up survey of school children in Scotland (began Sept 2008) providing national indicator of mode of travel • Incorporated into Cycling Action Plan for Scotland • Partnership project: Sustrans (Scotland team and R&MU) and STCs working in Local Authorities
8. Scotland Hands-Up Approach/method • Sustrans provide materials for STCs who pass on to schools, local collation • Survey asks about usual or normal mode of travel for the school journey – how do you normally travel to school • Survey during a specified week each September • Response options: • Walk - Driven • Cycle - Bus • Scooter/Skate - Taxi • Park & Stride - Other • R&MU conduct overall collation, analysis and reporting
8. Scotland Hands-Up Participation • 32 Local Authorities across Scotland 2008 – 29 LAs participated, 1,824 schools and 396,337 pupils 2009 – 31 LAs participated, 1,939 schools and 417,474 pupils Response rate • Calculated for participating Local Authorities only 2008 –75.8% 2009 – 82.1%
8. Scotland Hands-Up - Results • 49.8% of children surveyed travel to school in an active way, either by walking, cycling or using a scooter or skate board in 2009 compared to 51.8% in 2008 • 2.3% of all pupils cycle in 2009 compared to 2.8% of all pupils cycling in 2008 • 22.0% of all children are driven to school in 2008, this increases to 23.3% in 2009 • A similar proportion of children took the bus in both years (18%)
9. Our questions to TTSAC • Wider use of data sets? • Alternative data sets? • Analytical processes? • Wider partnerships?