Download

1 / 20
200 likes | 238 Views
Learn about the methods and results of monitoring walking and cycling initiatives in Scotland by Sustrans, with key performance indicators and evaluation metrics.

E N D
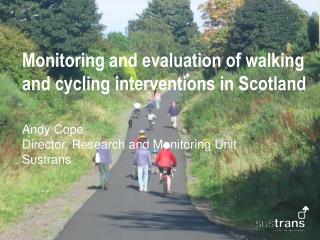
Monitoring and evaluation of walking and cycling interventions in Scotland Andy CopeDirector, Research and Monitoring UnitSustrans
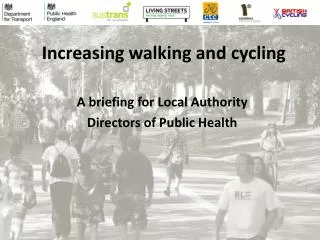
1. Context Sustrans in Scotland… • National Cycle Network • Connect2 • Active Travel • School Travel • Liveable Neighbourhoods • … • £3.5m in 2009/10 from Scottish Government
2. KPI ‘sets’ Five distinct areas… • Engineering • Education • Encouragement • Enforcement and compliance • Evaluation
3. Evaluation KPIs Three distinct areas… • Changes in usage on the National Cycle Network and other local cycling and walking networks • Community and wider benefits • Process monitoring
4. Changes in usage on the NCN and other local cycling and walking networks Five distinct indicators/targets… • Trips on the NCN and NCN links increase 15% • Of 15% increase in trips, 25% will be new users • Increase usage on short links by 10% • Increase commuting trips on the NCN by 15% • 10% increase in active travel in intervention locations
5. Data generated: cycle count data The resource consists of: • Over 150 cycle counters that we know about • Data from 34 analysed • Non-parametric slope estimators
5. Data generated: cycle count data Average change in the average daily count over a one year period = 13%
6. Data generated: Route User Survey Weaknesses… • practical • sampling • statistical power • validation • translational But the strengths are replicability, deliverability, growing body of consistent evidence, increasingly robust in delivery context, useful as evidence
7. KPI example: trips on the NCN • Several distinct indicators • 20 counters show +6.3% per annum • [+1.3% at 14 non NCN sites; +4.5% across all sites] • NCN usage increased from 28.3 million trips in 2007 to 31.3 million trips in 2008, a +10.6% increase • Positive case studies, e.g. +240% pedestrian usage increase at Dumbarton
8. Scotland Hands-Up Context • Annual hands-up survey of school children in Scotland (began Sept 2008) providing national indicator of mode of travel • Incorporated into Cycling Action Plan for Scotland • Partnership project: Sustrans (Scotland team and R&MU) and STCs working in Local Authorities
8. Scotland Hands-Up Approach/method • Sustrans provide materials for STCs who pass on to schools, local collation • Survey asks about usual or normal mode of travel for the school journey – how do you normally travel to school • Survey during a specified week each September • Response options: • Walk - Driven • Cycle - Bus • Scooter/Skate - Taxi • Park & Stride - Other • R&MU conduct overall collation, analysis and reporting
8. Scotland Hands-Up Participation • 32 Local Authorities across Scotland 2008 – 29 LAs participated, 1,824 schools and 396,337 pupils 2009 – 31 LAs participated, 1,939 schools and 417,474 pupils Response rate • Calculated for participating Local Authorities only 2008 –75.8% 2009 – 82.1%
8. Scotland Hands-Up - Results • 49.8% of children surveyed travel to school in an active way, either by walking, cycling or using a scooter or skate board in 2009 compared to 51.8% in 2008 • 2.3% of all pupils cycle in 2009 compared to 2.8% of all pupils cycling in 2008 • 22.0% of all children are driven to school in 2008, this increases to 23.3% in 2009 • A similar proportion of children took the bus in both years (18%)
9. Our questions to TTSAC • Wider use of data sets? • Alternative data sets? • Analytical processes? • Wider partnerships?