Download
1 / 37
370 likes | 389 Views
Analyze the performance of learning programs in Q1 2018 and determine if business results align with objectives. Evaluate key metrics, reporting portfolios, and identify areas of improvement. Present findings and recommendations to stakeholders.

E N D
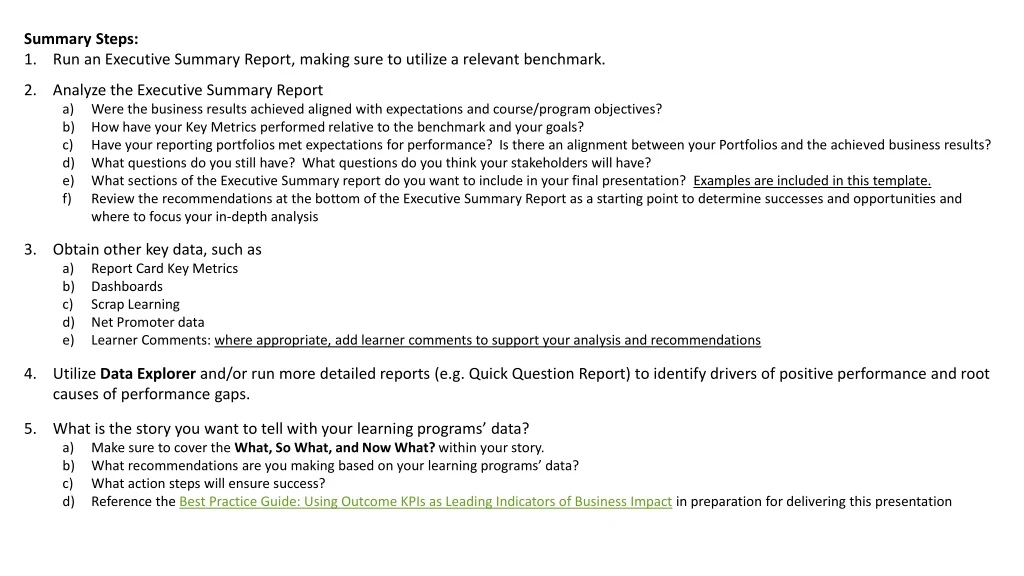
Summary Steps: • Run an Executive Summary Report, making sure to utilize a relevant benchmark. • Analyze the Executive Summary Report • Were the business results achieved aligned with expectations and course/program objectives? • How have your Key Metrics performed relative to the benchmark and your goals? • Have your reporting portfolios met expectations for performance? Is there an alignment between your Portfolios and the achieved business results? • What questions do you still have? What questions do you think your stakeholders will have? • What sections of the Executive Summary report do you want to include in your final presentation? Examples are included in this template. • Review the recommendations at the bottom of the Executive Summary Report as a starting point to determine successes and opportunities and where to focus your in-depth analysis • Obtain other key data, such as • Report Card Key Metrics • Dashboards • Scrap Learning • Net Promoter data • Learner Comments: where appropriate, add learner comments to support your analysis and recommendations • Utilize Data Explorer and/or run more detailed reports (e.g. Quick Question Report) to identify drivers of positive performance and root causes of performance gaps. • What is the story you want to tell with your learning programs’ data? • Make sure to cover the What, So What, and Now What? within your story. • What recommendations are you making based on your learning programs’ data? • What action steps will ensure success? • Reference the Best Practice Guide: Using Outcome KPIs as Leading Indicators of Business Impact in preparation for delivering this presentation
MTM Stakeholder Presentation Examples and Guidance
Executive Overview • Successes • Opportunities • Next Steps Recommended structure for your stakeholder presentation.
Executive Overview Short initial section that provides a summary of performance, successes and opportunities. Your goal is to get everyone focused on the right things from the beginning.
Q1 2018 Learning Programs Summary Successes • NPS above benchmark • Operational Efficiency and Mitigate Risk Portfolios are achieving intended Business Results • Courseware scores at/above benchmark Opportunities • Increase Performance Improvement • Increase Manager Support on the job • Improve on the job application for some strategic courses • Monitor/Improve Instructor performance Provide a synopsis of your successes and opportunities, based on your summary data and detailed/root cause analysis. The areas of opportunity are a call to action to improve or change something, based on what your findings while putting the summary together
Option 1: Infographic summary Data for the donut charts mostly comes from the Report Card Executive Summary Business Results and ROI from the Exec Summary Report *77% Bench *43% Bench *68% Bench InnovateU *77% Bench Reported ROI: 4.02* *Benefit to Cost Ratio: for every dollar spent, ~4 dollars were returned in benefit *38% Bench *Benchmark = Corporate Universities (All) *13% Bench Outcomes Effectiveness
Option 2: Dashboard (a Dashboard subscription is required for this option) Executive Summary
Option 3: Text-based summary Executive Summary Data from this slide mostly comes from the Executive Summary and the Report Card but the strength and opportunity sections may come from other reports (NPS, QQR, etc). The area of opportunity is a call to action to improve or change something, based on what you find while putting the rest of the summary together. According to learners who responded to the post event survey:
Successes Based on your own data analysis, pick 1-3 successful areas to focus on, and include those relevant slides after this section header. Examples are provided in this template; however, your presentation should reflect your own data. Your detailed analysis with Data Explorer or other reports will help you to diagnose drivers of performance.
Opportunities Based on your own data analysis, pick 1-3 opportunities for improvement to focus on, and include those relevant slides after this section header. Examples are provided in this template; however, your presentation should reflect your own data. Make sure that you are prepared to discuss the underlying root cause of any performance gaps. Your detailed analysis with Data Explorer or other reports will help you to diagnose drivers of performance (both good/bad).
The remaining slides are provided as a “bank” of possibilities for presenting different KPIs and should be customized based on your own learning programs’ performance.
Net Promoter Example of how to present NPS Data. NPS is a reflection of the learners’ perceived value of training (would they recommend to others). Tips: look at NPS by Course and Demographic to identify wins or areas of focused improvement. Reference the Key Metrics Report by Net Promoter Score knowledge article and Key Metrics Report Net Promoter Score Job Aid in the Help Guide for additional guidance in presenting this data.
Net Promoter Score How likely are you to recommend this learning experience? 43% Overall NPS for Q1 vs. Benchmark of 38% Show NPS by course, and it may be helpful to reference any specific NPS by demographic data that looks interesting in the additional findings.
Performance Management Foundations NPS below benchmark Demographic analysis for Performance Mgmt Foundations reveals individuals with higher tenure have lower NPS Indication that wrong audience is sent to this training Provide additional insights and recommendations based on your analysis. Note that these do not all need to be positive or negative. NPS Additional Findings & Recommendations • Recommendations: • Interview learners from lower-scoring demographic groups to identify the disconnect between the course objectives/content and application • Connect with HR to determine if there’s a way to “shore up” intended audiences by course • Connect with course designers to ensure that appropriate real-world application examples for intended learner audience are included in each training
Impact and Value Example of presenting Impact and Value, aligned to Portfolio performance. For additional insights into presenting this information, reference the Key Metrics Report by Performance Improvement Overview knowledge article, the Key Metrics Report by Performance Improvement Job Aid, and the explanation of how PI is calculated in the MTM Help Guide.
Estimated On-the-Job Performance Improvement Estimated Performance Improvement (PI) Calculation* *PI calculation is based on Phillips’ ROI Methodology
Validating Business Results by Portfolio Example of presenting Business Results, filtered to each Portfolio to validate whether Portfolio objectives were achieved. Data comes from the Exec Summary Report. Operational Efficiency 5 Safety Drive Growth Quality 5 Productivity 80% 72% 75% 80% 5 Productivity Learning Effectiveness 6 Cycle Time 51% 51% 70% 75% 5 Sales Manager Support 6 Cost 70% 70% 48% 70% Organization Support 5 Customer Satisfaction Application 82% 80% 68% 50% Application Mitigate Risk Foundational Skills Quality 5 Productivity 6 Risk The metrics above represent the % of respondents who responded positively to each scorecard indicator
Mitigate Risk courses: Delegating from the Middle, Leadership 2020 Operational Efficiency course: Managing Virtual Teams Foundational Skills courses: Effective Coaching Conversations Driving Growth courses: Account Planning Fundamentals, Performance Management Foundations Business Results Additional Findings & Recommendations Pull root cause from Data Explorer analysis • Recommendations: • Focus improvement efforts on Performance Management Foundations (correct audience, courseware improvements) to improve performance for Driving Growth portfolio • Focusing on improving Support Tools (specifically pre- and post-training manager support) to drive portfolio performance upward for Foundational Skills and maintain/improve performance of Mitigate Risk and Op Efficiency
Job Application Example of presenting Job Application (scrap) data. Additional resources include the Key Metrics Report by Scrap Learning Overview and the Key Metrics Report by Scrap Learning Job Aid.
Post Event (Predicted): I will use _% of this content on the job. Follow-up (Reported): I have used _% of the content on the job. Reduce Scrap, Increase Performance Slide provides context around the scrap learning metric = Learning Organization> 300 organizations> 18 million evaluations 40% As Scrap decreases, Estimated Performance Improvement due to training increases, providing more benefit to the organization. Performance Gain Due to Learning 20% 0% 60% 30% 0% Scrap Learning Rate Source: CEB analysis.
Higher Scrap = Less Job Application Data comes from the: Key Metrics Report and Scrap Learning Output Post Event Follow-up
Key Drivers* of Scrap: Courseware: “The content was relevant to my job.” Support Tools: “The participant materials (manual, presentation handouts, job aids, etc.) will be useful on the job.” Reduce Scrap to Increase Application Key Drivers and recommendations come from your Instant Insights Dashboard • Recommendations: • Interview learners from lower-scoring demographic groups to identify the disconnect between the course objectives/content and application • Connect with HR to determine if there’s a way to “shore up” intended audiences by course • Connect with course designers to ensure that appropriate real-world application examples for intended learner audience are included in each training • Have Instructional Designers examine low-scoring courses to determine where revisions or additions can be made to support materials *The greatest strengths, calculated in MTM, relative to our scrap learning percentage; the areas to focus on first to reduce scrap
On-the-Job Support Example of presenting Support Tools data
Pre- and post-training support is a primary driver of on-the-job application of learning Ensuring that learners and managers discuss learning expectations both before and after learning can increase learner performance up to 20% Lack of support is a primary driver of scrap Support Tools Impact: On-the-Job Application Data comes from the Report Card and Data Explorer (Compare)
Student and Manager Pre- and Post-Training Support: The Classic Disconnect Data comes from the Report Card Support Learners Receive: My manager and I have discussed how I can apply what I learned. (3.68) (Benchmark: 4.61) My manager and I discussed my goals for attending this learning experience. (5.20) (Benchmark: 5.83) Support Managers Provide: My employee and I have discussed how they can apply what was learned. (3.78) (Benchmark: 5.18) Prior to their attendance, my employee and I discussed the reasons for participating in this learning experience. (6.05) (Benchmark: 5.61) • Recommendations: • Hold an education session for managers to articulate the expectations and best practices for them to support the application of learning program • Provide managers with templates or job aids they can use to hold expectation-setting and follow-up conversations with their employees • Direct learners to email their action plans to their managers at the conclusion of each class • Have Instructional Designers examine low-scoring courses to determine where revisions or additions can be made to support materials
Content Example of presenting Courseware/Content performance
Pull Learner Comments from Data Explorer or the Learner Comments – Learner Sentiment Variance Report Content Successes Courseware stats are from Report Card Top 3 Courses “The real world examples provided practical application of the training.” “Great content – I learned a lot of new information in this class.” Course Performance from Data Explorer, filtered to the Courseware Question Category “I thought the examples were great, they related to some of the examples I’ve encountered on the job.”
Pull Learner Comments from Data Explorer or the Learner Comments – Learner Sentiment Variance Report Content Opportunities Courseware stats come from Report Card Bottom 3 Courses “I was familiar with all the content presented – I didn’t learn anything new.” “Too basic for my level – please have a part II of this class.” Course Performance from Data Explorer, filtered to Courseware Question Category • Recommendations: • Correct audience for these courses by updating course descriptions in our catalog to include intended audience/level • Revise courseware to provide more on-the-job application activities and examples • Ensure Instructors are trained on how to discuss job application and relevance • Ensure managers discuss training expectations both before and after training “Show us some examples within our company.”
Training Delivery Example of presenting training delivery results
Training Delivery Highlights Overall Instructor Performance, compared to benchmark Bottom 3 Instructors Top 3 Instructors Data comes from the Report Card and Data Explorer. Data Explorer (Top 3/Bottom 3)is filtered to the Instructor Question Category • Recommendations: • Maintain current Instructor development programs to ensure performance remains at/above benchmark for all instructors • Stretch goal: Work with Instructors to ensure they understand how they influence other learning KPIs and can impact on-the-job application of learning
Recommendation 1: Recommendation 2: Recommendation 3: Strategic Recommendations Recommended next steps to take with the data. Use the “What, So What, Now What” framework, and if there are a couple of meaty recommendations, feel free to lay them out 1 per slide, across multiple slides.
MTM Measurement Methodology A summary of the data contained in this report: • Date range: • # Classes: • # Courses: • # Surveys: • Benchmark comparison:
MTM Standard Survey KPIs • MTM’s suite of standard surveys contain a balanced set of KPIs to: • Run L&D like a business • Articulate L&D’s contribution to business objectives • Align and partner with the business Internal “Run L&D” KPIs Align/Partner with the Business KPIs L&DFocus BusinessFocus


