Download
1 / 15
150 likes | 232 Views
Learn how data-driven change can boost student retention on campus. Discover strategies to bridge the gap between high and low-income students, with tools and guidelines from the Pell Institute.

E N D
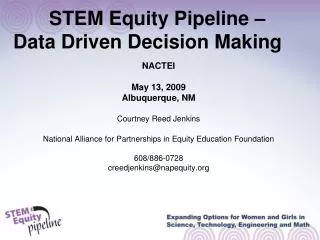
Data-Driven Change: Tools to Improve Campus-wide Retention Derek Price, DVP-PRAXIS LTD Vincent Tinto, Syracuse University/Pell Institute for the Study of Opportunity in Higher Education Pell Institute for the Study of Opportunity in Higher Education Council for Opportunity in Education September 6, 2007 Chicago, Illinois
Overview: • Declining gap in access between high and low-income students • Continued gap in college completion between high and low-income students • Continuing failure to campuses to develop effective and systematic strategies to promote success of low-income students • USA Funds funded project
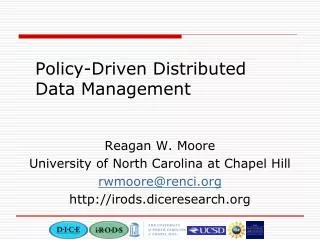
Data-Driven Change DATA AT THE CORE
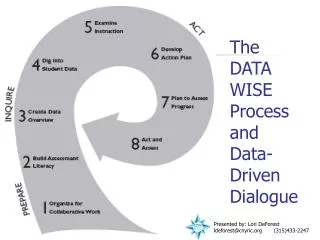
Stage 1: Map the Current State of Affairs • Document Student Outcomes • Conduct Student Success Inventory • Create Longitudinal Cohort Database
Document Student Outcomes • Disaggregate • Race and Ethnicity • Gender • Socioeconomic Status (e.g. Pell Grant Recipient) • Core Outcomes • Course Success Rates (Gateway and Developmental) • Credits Completed vs. Attempted • Term-to Term Retention • Cumulative Credits Earned • Degree/Certificate Completion
Student Success Inventory • List of Current Programs and Assessment Activities • Number of Students Served (each term) • Evaluation Data, if available • Outcomes • Operations • Revenue Sources (e.g., grants, dean’s discretionary, general fund)
Longitudinal Cohort Database • To follow a defined set of students (a cohort) over time • To document the flow of students through the institution • To identify leakage points for further investigation • To provide baseline data for communicating with campus leaders • To measure the effectiveness of interventions
Stage 2: Communicating Gaps • Building ownership for gaps in student success across the campus • personnel closest to the action (action leaders) – faculty, staff and program coordinators – should take a leadership role in reviewing gaps in student success and identifying the best strategies to close these gaps • Engage low-income students directly • student surveys of satisfaction or engagement • focus groups about their experiences with support services
Stage 3: Innovate and Implement • College teams (faculty, staff and administrators) use the data collected via administrative records and surveys, and information gathered through campus dialogues, to begin identifying strategies to close gaps in student success for low-income students • Some examples: • expanding existing programs to serve more low-income students • adding academic support services to key classes that were identified as stumbling blocks for low-income students • piloting new programs
Stage 4: Evaluation • Design an evaluation plan that includes both quantitative and qualitative data collection methods • Set explicit student outcome objective • Set goals based on the data reviewed during stages 1 and 2 • Set reasonable – that is, achievable - goals
Data-Driven Change • A 12 month process to map the current state of affairs, communicate gaps, innovate and implement new or expanded programs and services • College leaders can become change agents who use data to: • Set Priorities • Choose Strategies • Evaluate Outcomes.
Data-Driven Change • This process of data-driven change is a key indicator of institutional quality and of a commitment to improving student success.
Tools from the Pell Institute • Data Templates • Student Success Inventory Guidebook • Campus Dialogue Protocol • Evaluation Guide • Support from Retention Experts • On-site and off-site Workshops
Discussion Topic A • Are these kinds of data (longitudinal, student outcome, student surveys/focus groups) regularly reviewed and discussed on your campus? • What would it take to get your campus to use data more effectively –for example as part of a data-driven change strategy? • Who should be involved?
Discussion Topic B • Think about a group of TRIO students who could be defined as a cohort • What data do you now collect about this cohort? • What outcomes are you interested in for this group? • How can you know if TRIO students are doing better or worse than similar students on these outcomes?