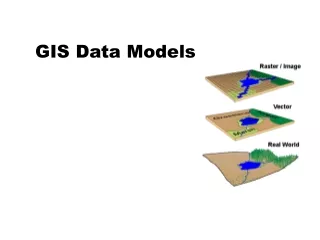
GIS Analysis Models
GIS Analysis Models. GIS Analysis Model Graphical modeling framework tied to actual GIS functions Functions, Data, Numerical Models, Tools, etc. ArcGIS 9 Model Builder. ArcGIS 9 Model Builder.


GIS Analysis Models
E N D
Presentation Transcript
GIS Analysis ModelGraphical modeling framework tied to actual GIS functionsFunctions, Data, Numerical Models, Tools, etc.
From Designing Gdbs - Ch 7Arc Hydro & HEC-RASHydrologic Engineering Centers River Analysis System See also “Demo 2” from Apr 6 lecture
Arc Marine & Model Builder From Brett Lord-Castillo, M.S. thesis, and Lord-Castillo et al., Transactions in GIS, in review, 2009
Arc Marine & Model Builder Models to automatically extract environmental data layers for spatio-temporal analysis Model: Get-SST AML to Modeler conversion at ArcGIS 9.x From Marine Data Model Technical Workshop, 2005 ESRI UC, Halpin et al.
The Anatomy of a GIS Analysis ModelBerry, Chs. 24-26 • compare several GIS models to illustrate different analysis modeling approaches • compare varying levels of results from these models • GIS is only as good as its data • GIS is only as good the expression of its data
“It’s All Downhill from Here” • the case for landslide susceptibility • terrain steepness (high slope/low slope) • soil type (unstable/stable) • vegetation cover (bare/abundant)
BINARY model:codes cells 1 for susceptible0 for unsusceptiblemultiplicative: cells must meet all 3 criteria
BINARY model:multiplies maps for Y/N solutionRANKING model:adds maps for a range of solutions
RATING model:averages maps for an even greater range of solutionsscale of 1 to 9 (most) for each condition
RATING model:for example one cell might be9 in SL layer, 3 in SO, 3 in CO(9 + 3 + 3) / 3 = 5 or moderate susc.
Weighted Rating Model • suppose SL is considered to be 5 times more important than SO or CO? • so one cell might be:9 * 5 in SL layer, 3 in SO, 3 in CO • ((9*5)+ 3 + 3) / 3 = 17 • fairly high susc.
4 Models for Landslide Susceptibility:Banana Bread to Fruit Cake! • BINARY • 1 for SL, 0 for SO, 0 for CO • 1 * 0 * 0 = 0 NO susceptibility • RANKING • 1 for SL, 0 for SO, 0 for CO • 1 + 0 + 0 = 1 LOW susceptibility • RATING • 9 for SL, 3 for SO, 3 for CO • (9 + 3 + 3) / 3 = 5 MODERATE susceptibility • WEIGHTED RATING • 9 for SL, 3 for SO, 3 for CO • ((9*5) + 3 + 3) / 3 = 17 HIGH susceptibility
Banana Bread to Fruitcake • data input to the models - constant • logic of models or conceptual fabric of process - different • rating models most “robust” • continuum of responses/answers • foothold to extend model even further • from critical to contributing factors
Extension of Landslide Model to Risk:Consider Proximity to Features That we Really Care About
Extending a GIS Model ( cont. ) • Risk • variable width road buffers as a function of SLOPE • buffer widens in steep areas • Extending hazard to risk • weighted roads based on slopes • weight roads based on traffic volume, emergency routes, etc. • buildings: commercial, residential, etc. • economic value of threatened features, potential resource loss
Additional Factors • in addition to or instead of SL, SO, CO other critical factors may be considered: • physical: bedrock type, depth to faulting • disturbance: construction areas, gophers? • environmental: storm frequency, rainfall patterns • seasonal: freezing and thawing cycles in spring • historical: past earthquake events
Water depth Sediment depth Substrate type Sediment type Exposure Rugosity/BPI Slope/Aspect Water chemistry Water temperature Voids/caverns (size & depth) Vegetation Biotic interactions Anthropogenic factors Benthic Habitat Example:Parameters Important to Benthic Species What can we measure directly, interpret, or derive? Deidre Sullivan, MATE Center, Monterey, CA
Bathymetric grid created from multibeam x,y,z data Monterey Bay data courtesy of MATE Center and Cal-State Monterey Bay
Rugosity grid derived from bathymetry using the Benthic Terrain Modeler Measure of surface area to planar area
Rugosity • Measure of how rough or bumpy a surface is, how convoluted and complex • Ratio of surface area to planar area Surface area based on elevations of 8 neighbors 3D view of grid on the left Center pts of 9 cells connected To make 8 triangles Portions of 8 triangles overlapping center cell used for surface area Graphics courtesy of Jeff Jenness, Jenness Enterprises, and Pat Iampietro, CSU-MB
Bathymetric Position Index (BPI)derived from bathymetry using the Benthic Terrain Modelerdusk.geo.orst.edu/djl/samoa/tools.html
(after Weiss 2001) Bathymetric Position Index(from TPI, Jones et al., 2000; Weiss, 2001; Iampietro & Kvitek, 2002) Measure of where a point is in the overall land- or “seascape” Compares elevation of cell to mean elevation of neighborhood
Substrate type interpreted from Backscatter or Side Scan Sonar images
Building a Suitability Model • What do we know about the species’ habitat requirements? • Can we describe these habitat requirements using GIS data? • Do we have enough information? Is it at the right scale? • Does the model work?
Validate the model & Benthic Terrain Modeler Bathymetric Position Index BPI
Using Standard Deviation to Classify Values 1 2 3 68% 95% 99%
Binary Model(Multiplication) 1 0 0 1 = * = * Areas that satisfy both criteria Rugosity greater than 1.2 SD BPI greater than 1.5 SD
Ranking Model(Addition) 1 0 0 0 2 1 = + 1 = + Ranking because it develops an ordinal scale of increasing suitability Rugosity is greater than 1.2 SD BPI greater than 1.5 SD
Rating Model Uses a consistent scale with more than two states to characterize the habitat (simple average) + = 1 0 0 1 1 2 Rugosity is divided into 4 classes by SD then reclassified to values of 1, 2, 3, 4 BPI is divided into 4 classes by SD then reclassified to values of 1, 2, 3, 4 Rating because it develops a relative rating based on the simple average of the factors
Uses a consistent scale with more than two states to characterized the habitat, however it is a weighted average Weighted Rating Model ( ) + = * 5 1 0 0 1 1 2 Rugosity is divided into 4 classes by SD then reclassified to values of 1, 2, 3, 4 BPI is divided into 4 classes by SD then reclassified to values of 1, 2, 3, 4 Weighted rating develops a relative ranking with the most critical factors given more weight
How do they compare? Ranking Binary Rating Wt. Rating
“Mapematics” • Rating models considered most “mapematical” • how were weighting factors decided? • guess-timates? • derived from predictive statistical technique? • need right set of maps/data over a large area • based on an experiment in the field? • lots of time, funding, energy • Review literature for existing mathematical model and make them “mapematical” (i.e., use them!)
GEO 580 ExamplePredicting presence of the sensitive lichen Usnea longissima in managed landscapesDylan Keon GEO 580 project
Gateway to the Literature • Joerin, F., Using GIS and outranking multicriteria analysis for land-use suitability assessment, Int. J. Geog. Inf. Sci., 15 (2), 153-174, 2001. • Jankowski, P., and T. Nyerges, GIS-supported collaborative decision making: Results of an experiment, Annals AAG, 91 (1), 48-70, 2001. • Chau, K.T. et al., Landslide hazard for Hong Kong using landslide inventory and GIS, Computers & Geosciences, 30: 429-443, 204.