Raster models in GIS
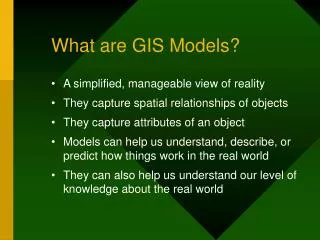
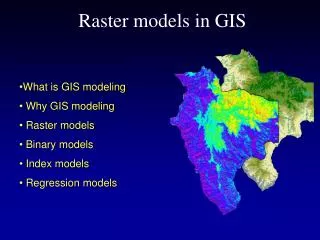
Raster models in GIS. What is GIS modeling Why GIS modeling Raster models Binary models Index models Regression models. What is a GIS model?. It’s spatially explicit! Abstraction and simplification of reality Often used to identify locations that meet specific criteria

Raster models in GIS
E N D
Presentation Transcript
Raster models in GIS • What is GIS modeling • Why GIS modeling • Raster models • Binary models • Index models • Regression models
What is a GIS model? • It’s spatially explicit! • Abstraction and simplification of reality • Often used to identify locations that meet specific criteria • Can be used to infer an unknown quality or quantity using relationships with known or measurable quantities or qualities • Can be used to generate new data Predicted Mountain Bluebird habitat in Idaho
Why GIS modeling? • Simplification of reality • Increases the understanding of a situation or system • Provides useful guidance • Predicting the future • Extrapolation of information to other areas • Evaluations of scenarios • Explain trends
Applications in Natural Resources • Predicting future conditions • Predicting impact of alternative management actions • Landuse planning • Site selection • Risk assessment - Identify areas of possible concern
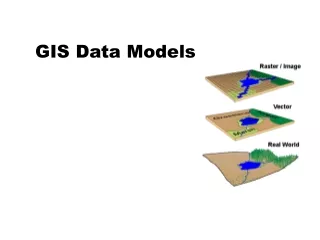
Raster data structure • Pixels! • Resolution is expressed in terms of pixel size. 30m X 30m for a USGS DEM • Best for representing continuous gradients (e.g. elevations, image brightness values etc.) • Can represent continuous or categorical (thematic) information • Not as precise as the vector model for calculating area and length • ‘Slivers’ as a result of data overlay is less of a problem in raster data compared to vector data
Binary models • Represent presence or absence of a phenomena as 1 or 0 respectively • Categorical and very simple • Often used as components in more complex models • Uses include habitat models and site selection models Craig Mountain Slope Green – < 20 degrees Yellow - > 20 degrees
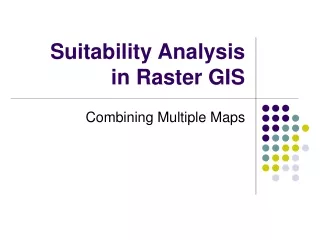
Raster Index Models • Calculates an index value for each pixel and creates a ranked map. • Weighted linear combinations is a common method • The importance of each factor is evaluated against each other. • Commonly the data for each criteria is standardized (scaled to an interval between 0 and 1)
Raster regression models • Are based on linear or logistic regression • Variables are entered as grid (raster) cell values and outputs are rendered as grids • This is a regression model based estimate of foliar biomass (Kg/ha) from lidar canopy height data • Equation: • FB = 0.05*TB • TB = 5.5 + 0.0385*(CH)2 • Where: CH is Canopy Height • and TB is Total Biomass
Modeling Process 0. Define objectives and purpose • State assumptions • Identify model variables • Locate GIS data representing the model variables at the desired scale • Implement the model • Evaluate model results
Example: Coeur d’Alene Salamander Define objectives and purpose To create a model for potential habitat for the Coeur d’Alene Salamander 2.State assumptions This model will be developed at a 30 m scale for the state of Idaho. Species specific information from adjacent states apply to Idaho. 3.Identify model variables Rangemaps, elevation, vegetation, distance to water
4. Locate GIS data Criteria for Coeur d’Alene salamander habitat, Idaho GAP Predicted to occur in… • Northern Idaho • < 90m from water • < 1525m elevation • Mesic forest and riparian Idaho Gap Analysis Project 2001
5. Final Habitat Model Leah Ramsay Coeur d’Alene Salamander Final WHR Model Idaho Gap Analysis Project 2001
6. Model evaluation Present Model Present Absent Correct Present (CP) Omission (OM) Actual Absent Present Correct Absent (CA) Commission (CO) % Commission = CO / (CP + CO) % Omission = OM / (CP + OM)
Hazard and Risk • Hazard • A source of potential danger or adverse condition. • A natural event is a hazard when it has the potential to harm people or property. • Hazard Identification • The process of identifying hazards that threaten an area. • Hazard Mitigation • Sustained actions taken to reduce or eliminate long-term risk from hazards and their effects.
Risk • Risk • The estimated impact that a hazard would have on people, services, facilities, and structures in a community; the likelihood of a hazard event resulting in an adverse condition that causes injury or damage. • (hazard and risk definitions after FEMA 386-2)
Risk of what? Risk of ignition? Risk of fast spread? Risk of high fire severity? Risk to structures?
Risk of fast fire spread Northwest Management, Moscow, ID • Xeric cover types • South & west aspects • Ramp of yellow to red on a slope gradient • Latah County Plan • “The risk rating presented here serves to identify where certain constant variables are present that aid in identifying where fires typically spread the fastest across the landscape.”
Fuel Moisture • Concepts Wet things don’t burn Small things dry more quickly than big things Fire start with small fuels Fire spread is the fire starting over and over again • Dead fuels: • 1 hour – less than ¼” diameter • 10 hour – ¼” to 1” diameter • 100 hour – 1” to 3” diameter • 1000 hour – 3” to 8” diameter
Fuel Model • A way to put fuel into categories according to how it burns • There are several fuel model systems in use for wildland fire • Fire behavior software uses the Fire Behavior Prediction System models • Most models of wildland fire fuels initially classify fuels as grass, shrub, timber, or slash
Fuel Model • Considerations: • Fuel load • Fuel moisture • Ratio of surface area to volume • Depth of the fuel bed • Horizontal/vertical orientation
Fuel models (Anderson, 1982) FM 1 – Short Grass FM 2 – Open Timber Grass Understory FM 5 – Short Brush FM 8 – Closed Short Needle Conifer FM 9 – Closed Long Needle Conifer FM 10 – Closed Timber Heavy DWD FM 11 – Light Logging Slash
BEHAVE outputs: Rate of spread Rate of Spread for Fuelmodels at 5 mph wind