Download
1 / 75
1.11k likes | 2.44k Views
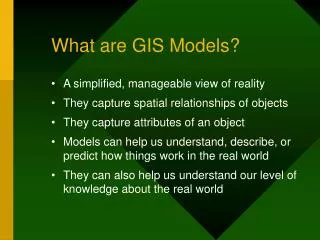
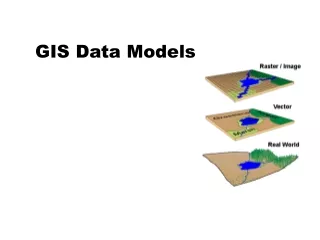
GIS Data Models. Geographic information. Characteristics of Geographic Information Location! volume Dimensionality Point Line Area Continuity Feature field. Building complex features. Simple geographic features can be used to build more complex ones.

E N D
Geographic information • Characteristics of Geographic Information • Location! • volume • Dimensionality • Point • Line • Area • Continuity • Feature • field
Building complex features • Simple geographic features can be used to build more complex ones. • Areas are made up of lines which are made up of points represented by their coordinates. • Areas = {Lines} = {Points}
Properties of Features • size • distribution • pattern • contiguity • neighborhood • shape • scale • orientation.
GIS Analysis • Much of GIS analysis and description consists of investigating the properties of geographic features and determining the relationships between them.
GIS Capability • A GIS package should be able to move between • map projections, • coordinate systems, • datums, and • ellipsoids.
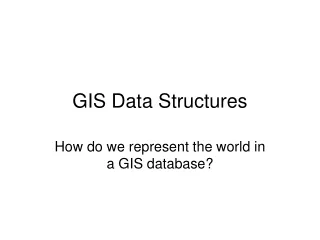
Maps as Numbers • GIS requires that both data and maps be represented as numbers. • The GIS places data into the computer’s memory in a physical data structure (i.e. files and directories). • Files can be written in binary or as ASCII text. • Binary is faster to read and smaller, ASCII can be read by humans and edited but uses more space.
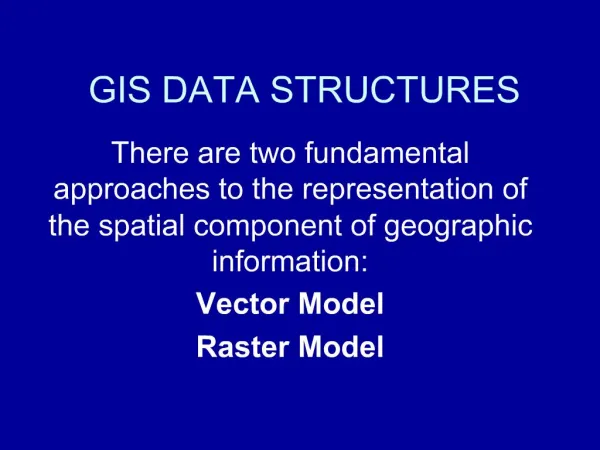
The Data Model • A logical data model is how data are organized for use by the GIS. • GISs have traditionally used either raster or vector for maps.
Two approaches to handling spatial data with GIS: • Raster model • Vector model • Points, • lines, • polygons
Features and Maps • A GIS map is a scaled-down digital representation of point, line, area, and volume features. • While most GIS systems can handle raster and vector, only one is used for the internal organization of spatial data.
Rasters and vectors can be flat files … if they are simple Flat File Vector-based line 4753456 623412 4753436 623424 4753462 623478 4753432 623482 4753405 623429 4753401 623508 4753462 623555 4753398 623634 Raster-based line Flat File 0000000000000000 0001100000100000 1010100001010000 1100100001010000 0000100010001000 0000100010000100 0001000100000010 0010000100000001 0111001000000001 0000111000000000 0000000000000000
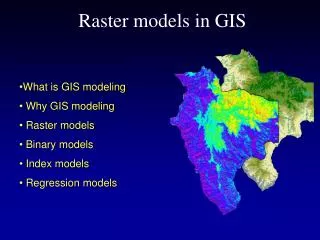
A raster data model uses a grid. • One grid cell is one unit or holds one attribute. • Every cell has a value, even if it is “missing.” • A cell can hold a number or an index value standing for an attribute. • A cell has a resolution, given as the cell size in ground units.
Raster GIS • Raster Data Model • Rows and Columns of Cells (Array) • Area of Cell equals Spatial Resolution • Value for each cell records type of object or condition • Cells do not correspond to spatial entities in real world • A road is a group of cells, not a single entity • Cells are considered Homogeneous Units
Two approaches to handling spatial data with GIS: • Raster model • Vector model • Points, • lines, • polygons
Generic structure for a grid Grid extent Grid cell s w o R Resolution Columns Figure 3.1 Generic structure for a grid.
Definitions • Raster - A format for storing, processing, and displaying graphic data in which graphic images are stored as values for uniform grid cells or pixels. • Pixels - Abbreviation for picture element, the smallest indivisible element that makes up an image. In raster processing, data is represented spatially on a matrix of grid cells, called pixels, which are assigned values for image characteristics or attributes.
More Definitions • Resolution - A measure of the accuracy or detail of a graphic display, expressed as dots per inch, pixels per line, lines per millimeter, etc. • Spatial Resolution - The accuracy associated with the capture of ground information as reproduced in a digital format or graphic display. For example, 10-foot pixels vs. 100-foot pixels.
Definitions • Minimum Mapping Unit - The smallest element we can uniquely represent in our data.
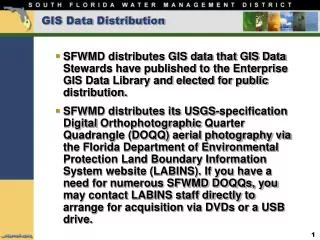
Sources of Raster Data • Satellite data • LANDSAT • SPOT • Scanned aerial photography • Digital Orthophotography • Scanned maps and documents
From where do we get Raster Data? • SCANNED Aerial photographs • photographs are NOT raster images but SCANNED images ARE • SCANNED maps • Satellite images
Why does it matter where the cell data come from? • It’s hard to tell just by looking at the image!
Grids and missing data Figure 3.8 GIS data layer as a grid with a large section of “missing data,” in this case, the zeros in the ocean off of New York and New Jersey.
Why use Raster? • Overlay Analysis/Overlay Operations • Arithmetic Operations • Addition • Subtraction • Division • Multiplication • Logical (Boolean) Operations • Where conditions occur or do not occur together • AND, OR, NOT, GT, LT, etc.
Raster GIS Applications • Integrate images to georeferenced data • i.e., parcel deed image linked to parcel centroid • Document Imaging • Natural Resource applications where: • Positional accuracy relaxed • Imagery-oriented
Raster Applications • Utility Corridor Siting • Environmental Mapping • Natural Communities Mapping • Forest resource planning • Spatial data variability decisions • Forest inventory • Wildlife habitat analysis
More Raster Applications • Wetlands Vegetation Inventory & Analysis • Agricultural analysis • Planetary analysis (including lunar) • Vector Updating • Digital Terrain Modeling • Flood Control & Emergency Preparedness • Communication System Engineering
Raster Limitations • Aesthetics • Data storage requirements • Overlay operations performed on every cell • Sparse data sets require as much processing as dense ones
RASTER -- summary • A grid or raster maps directly onto a programming computer memory structure called an array. • Grids are poor at representing points, lines and areas, but good at surfaces. • Grids are good only at very localized topology, and weak otherwise. • Grids are a natural for scanned or remotely sensed data. • Grids suffer from the mixed pixel problem. • Grids must often include redundant or missing data. • Grid compression techniques used in GIS are run-length encoding and quad trees.
Rasters are faster, but... • Points and lines in raster format have to move to a cell center. • Lines can become fat. Areas may need separately coded edges. • Each cell can be owned by only one feature. • As data, all cells must be able to hold any cell value. • It is very difficult to precisely position features in space.
Vector GIS Data Model • Precisely position features in space • Points, Nodes, vertex, single X,Y coordinate pair • Lines, Arcs, series of X,Y coordinate pairs • Area, Polygons, area as a closed loop of X,Y coordinate pairs
The Vector Model • A vector data model uses points stored by their real (earth) coordinates and so requires a precise coordinate system. • Geographic Coordinate System • Latitude/Longitude • Cartesian Coordinate Systems • X,Y Coordinate system • State Plane • UTM (Universal Transverse Mercator) • Lines and areas are built from sequences of points in order. • Lines have a direction to the ordering of the points. • Polygons can be built from points or lines. • Vectors can store information about topology.
VECTOR • At first, GISs used vector data and cartographic spaghetti structures. • Collection of coordinate strings with no structure • Cartesian coordinates stored in data structure • No spatial relationships stored • Inefficient data storage technique • Vector data evolved the arc/node model in the 1960s. • In the arc/node model, an area consist of lines and a line consists of points. • Points, lines, and areas can each be stored in their own files, with links between them.
Arc/node map data structure with files 13 1 x y 11 e 2 x y l i 12 3 x y F 10 2 s 4 x y t 7 n 5 x y i 5 o POLYGON “A” 6 x y P 9 7 x y 4 8 x y 6 1 9 x y 2 10 x y 3 11 x y 8 12 x y 13 x y 1 File of Arcs by Polygon 1,2,3,4,5,6,7 1 A , Area, Attributes : 1,2 1,8,9,10,11,12,13,7 2 Arcs File Figure 3.4 Arc/Node Map Data Structure with Files.
The topological vector model uses the line (arc) as a basic unit. Areas (polygons) are built up from arcs. • The endpoint of a line (arc) is called a node. Arc junctions are only at nodes. • Stored with the arc is the topology (i.e. the connecting arcs and left and right polygons).