Download
1 / 8
80 likes | 223 Views
Desurvey: W.P.1.3.3 John B. Thornes (K.c.l ). Desurvey Mission.

E N D
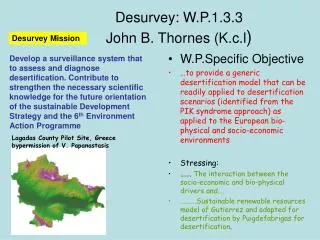
Desurvey: W.P.1.3.3John B. Thornes (K.c.l) Desurvey Mission Develop a surveillance system that to assess and diagnose desertification. Contribute to strengthen the necessary scientific knowledge for the future orientation of the sustainable Development Strategy and the 6th Environment Action Programme • W.P.Specific Objective • …to provide a generic desertification model that can be readily applied to desertification scenarios (identified from the PIK syndrome approach) as applied to the European bio-physical and socio-economic environments • Stressing: • ……. The interaction between the socio-economic and bio-physical drivers and…. • ……….Sustainable renewable resources model of Gutierrez and adapted for desertification by Puigdefabrigas for desertification. Lagadas County Pilot Site, Greece bypermission of V. Papanastasis
Requirements Interface Machine Requirements Multiscaling Ease of parameterisation Readily available data sources Policy-implementation Interface Computer-based different scales different land-uses Machine PC platform Object –oriented implementation Graphic output
Syndromes for Alentejo A group of signs and symptoms which, when present together allow the description and naming of a particular disease Table 1.3.3.(2)
Regev-Gutierrez Harvesters • U. Regevand A. Gutierrez have developed a new economic-ecology paradigm • Based on the multi-level food chain, with resources at bottom, and human harvesting at top. • It is constrained by objective functions(such as private maximization of gain, or community sustainability. • The result is contained in a stability analysis Grazers Consumption Vegetation Production Resources-Rain/sunshin-nutrients Source
α coefficient (y) against biomass Respiration term Take-off by predator at level i+1 Logistic growth for level i minus respiration Baumgartner-Gutierrez equation for mass change at level i Xi is mass at i th level exponent is ratio of supply at next lower level (i-1) to demand at this level Ci is conversion of demand (di) at ith level ui is respiration demand at level i
Herbivore isocline vs M1,M2,M3From Gutierrez(1996) Fig. 8.1 Herbivore isocline (M2)vs M1 From Gutierrez(1996)Fig8.1) α is apparency of trophic level to its consumer(how easy it is to get food) θ2D2 is converted demand from this level M1 is plant (resource in this case) M2 a herbivore M3 a predator Gutierrez, A.P.(1996) Applied Population Ecology, A Supply-Demand Approach. Wiley
Land degradation Consumer Economic ecology model Producer Modified erosion Plant growth model Soil erosion model Resource-soil topography climate
Appendix I Baumgartner-Gutierrez equation for mass change of vegetation dM1/dt={θ1(1-e-λ1)D1 -r1M1b1}M1 Metabolic pool equation plants -(1-e-λ2)D2M2 Loss to herbivores in level above λ1=α1M0/D1M1 ratio of supply of resource to Demand from plants λ2 = α2M2D3/D3M3 ratio of supply of herbivores to Demand from predators M0=rain M1=vegetation M2=herbivores M3=carnivores α=accessibility Θ=conversion factor