Download
1 / 12
120 likes | 201 Views
This study explores the impact of river inputs and sea-ice cover on microbial and metazoan communities in Arctic coastal lagoons. It focuses on salinity, dissolved oxygen, optics, and their variations across seasons and depths. The analysis shows the influence of freshwater inflow, sea-ice melting, and nutrient dynamics on environmental characteristics and production in the Beaufort Sea coastal waters of Kaktovik, AK.

E N D
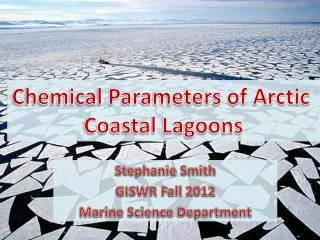
Chemical Parameters of Arctic Coastal Lagoons Stephanie Smith GISWR Fall 2012 Marine Science Department
Scope of Project • Coastal estuaries • highly productive • dependent on freshwater inflow to maintain gradients in environmental characteristics and delivery of nutrients and carbon that fuel production • How do river inputs and sea-ice cover interact to shape microbial and metazoan communities in coastal waters of the Beaufort Sea? • Seasonally & Spatially
Background • North Slope field study • Kaktovik, AK • 30 nm radius of Barter Island • 12 study sites • Various amounts of freshwater runoff from small rivers
Water Samples from 2 and 3 meters • Chemical parameters • Salinity • Dissolved Oxygen (DO mg/L) • Optics (absorbance) • a250 • SUVA • a250:365 • Sampling Seasons • April 2012 • June 2012 • August 2011/12
Steps to Map Creation • Compile Excel data .csv • Add Basemap– Nat Geo • WGS_1984_WebMercator_Auxillary_Sphere • Add .csv Display X,Y • GCS_NAD 1983 • Export to Shapefile • Symbology – Graduated colors (Interpolation would misrepresent the data)
2m 3m Salinity • April Normal to High Salinity in April Fresh water at 2m in June, and some hypersaline at 3m Brackish to Normal conditions in August
Dissolved Oxygen (mg/L) DO relatively the same throughout seasons (5-15mg/L) DO highest in June at 3m (28.9mg/L)
a250 – correlated with DOC Higher a250 = higher [DOC] Lowest in April, less DOC Highest in June, more DOC Moderate in August
SUVA – Specific UV absorbance(a254 normalized to DOC) High SUVA indicates that a large portion of the organics present in the water are aromatic Lowest in April Highest in June, more aromatics (No DOC data for August yet)
a250:365 Lower a250:365 = higher molecular weight Due to stronger light absorption by high-molecular-weight (HMW) CDOM at longer wavelengths Relatively moderate levels in April and August Higher levels in June, larger molecular weight
Summary • Salinity – highest in April, and in 3m June waters. June at 2m had the most fresh water • DO – moderate levels throughout seasons, but highest in June • a250, SUVA, a250:365 – Highest levels in June, more organic matter with high molecular weight and aromaticity
Conclusion • Sea-ice in April causes the waters below to be very salty, and have a lower amount of DOC • In June, ice melts and river water flows into the estuary bringing fresh water, nutrients, and organic matter productivity • “Spring Freshet” • In August, nutrients are used up and begin to revert back to depleated conditions