Download
1 / 36
360 likes | 971 Views
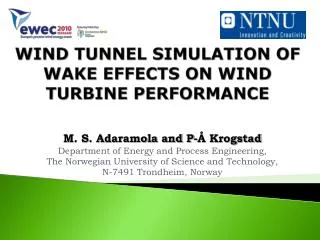
Numerical and Wind-Tunnel Simulation of Wind Loads on Smooth and Rough Domes. R.N. Meroney C.W. Letchford P.P. Sarkar. Powerpoint Presentations!. Structural Domes . Domes are commonly used to enclose large spaces because of their structural efficiency and economic benefit.

E N D
Numerical and Wind-Tunnel Simulation of Wind Loads on Smooth and Rough Domes R.N. Meroney C.W. Letchford P.P. Sarkar
Structural Domes • Domes are commonly used to enclose large spaces because of their structural efficiency and economic benefit. • Domes are excellent at resisting symmetric loading, but • Asymmetric loading may cause structural distress and failure.
Domed Sports Halls & Stadiums Pepsi Center, Denver Hubert H. Humphrey Metro-Dome, Min Houston Astrodome Little Sports Palace, Rome Sun Dome, Fukui, Japan
Assembly Hall Dome Assembly Hall, U. of Illinois Urbana/Champ
Domed Public Buildings Museums and Halls, Barlow Planetarium, CA ^ ^ Public Exhibition Halls Millennium Dome, London, 320 m diameter, 80,000 sq m floor space
US Pavilion, Osaka Exposition 1970 RCA (Hoosier) Dome Indianapolis, IN Carrier Stadium, Syracuse University Georgia Dome, Atlanta Silverdome, Pontiac, MI Inflated Domes
Inflated Domes (contd) Tokyo Dome “Big Egg” Stadium, Tokyo, Japan
Bulk Storage: Dust Supression, Water and Wastewater Treatment Covers Temcor Aluminum Domes Triangulated space truss system with triangulated panels
Bulk Storage: Coke Piles Pittsburgh, CA Marine Terminal Coke Storage Domes Three 55 m (180 ft) diameter hemispheres Los Angeles, CA Export Terminal Coke Storage Domes Construction Two 73 m (240 ft) diameter hemispheres, Shotcrete applied to interior of inflated airform mounted on footer and stem wall
Rough Surface Hemispheres Sometimes construction technique leaves surface texture rough!
CFD Validation Using Physical ModelingVERIFICATION BEFORE PROGNOSTICATION
Wind Effects on Hemispherical Domes • Inflated domes require internal pressures exceeding external pressures to avoid buckling. • Internal pressures must not be too large or excessive membrane or tensile forces occur, and membrane tears.
Wind-tunnel Study of Inflated Domes • Newman, Ganguli and Shrivastava (1984) studied pressure distributions on three inflatable domes in a boundary layer. • H/D = 0.5, 0.37 & 0.25, H/=0.12-0.13, U=7.5 m/s, Re=UD/=226,000 • FEM calculations show buckling occurs on plane of symmetry and upwind when the internal inflation pressures < 0.7-0.44 of the dynamic pressure at the dome top. 1 2 3
CSU WEFL Industrial Aerodynamics Wind Tunnel Hot Film Anemometer Postprocess Software PC-NT Computer Pressure Transducer Pressure Scanner CSU WEFL Wind Tunnel Experiment
20 m 2 m 1.8 m Grid: 86,000 cells Z = 1m Z = 0.8 m ASCE 7-98C Windtunnel Velocity Contours: Umax = 15 m/s Wind-Tunnel Initial Conditions
18,000 Cells 33,000 Cells 16,400 Cells 43,000 Cells Grid Systems: One and Two Domes
Boundary layer & Hex Grid Boundary layer & Tet Grid Hemisphere Grids
Single Dome Comparisons: Reynolds Number Variation • Reynolds Number = (U H/) = 185,000 • Reynolds Number = (U H/) = 1,440,000 • Conclusion: No significant difference
Single Dome Comparisons: Turbulence Models • Standard kappa-epsilon model (2 equations) • Reynolds stress model (7 equations) • Spalart Allmaras model (1 equation) • Conclusion: No significant difference
Cp Contours: numerical Cp Contours: experimental Pressure Coefficient Contours: Experimental vs Numerical:Approach wind at 0o 39
Pressure Coefficient Contours: Experimental vs Numerical:Approach wind at 90o Cp Contours: numerical Cp Contours: experimental
Conclusions • CFD calculations reproduced mean Cp behavior over smooth, rough and paired domes. • CFD calculations using k-, RNG, and Rey turbulence models gave similar results. • CFD calculations at high and low Reynolds numbers gave similar results.
GOOD LUCK WHALE WATCHING IS NOT AN EMERGENCY KEEP DRIVING Approaching the End