Case Study of a Tropopause Folding Event in Eastern North America on March 14-15, 2006
This study investigates a significant tropopause folding event that occurred over Eastern North America on March 14-15, 2006. By analyzing observational data and various modeling outputs, we explore the impact of stratosphere-troposphere exchange on tropospheric ozone levels. The findings highlight the HNO3/O3 ratio as an effective tracer for identifying fresh stratospheric intrusions. Despite successful modeling of stratospheric air transport, key challenges related to surface hydration linked to the event were identified. This research contributes to a better understanding of stratospheric influences on surface weather.

Case Study of a Tropopause Folding Event in Eastern North America on March 14-15, 2006
E N D
Presentation Transcript
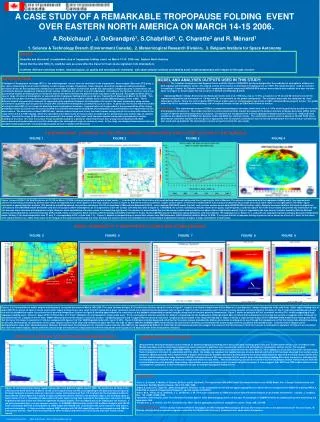
A CASE STUDY OF A REMARKABLE TROPOPAUSE FOLDING EVENT OVER EASTERN NORTH AMERICA ON MARCH 14-15 2006. • Robichaud1, J. DeGrandpré1, S.Chabrillat3, C. Charette2 and R. Ménard1 • 1. Science & Technology Branch (Environment Canada), 2. Meteorological Research Division, 3. Belgium Institute for Space Aeronomy • GOALS • Describe and document a remarkable case of tropopause folding event on March 14-15 2006 over Eastern North America. • Show that the ratio HNO3/O3 could be view as a new effective tracer for fresh ozone signature from stratosphere. • Confront different numerical models (meteorological, air quality and stratospheric chemistry) with observational evidence and identify some model weaknesses with respect to this type of event. INTRODUCTION Stratosphere-Troposphere exchange (STE) is the most important natural factor to contribute to the tropospheric ozone budget. Moreover, STE plays a key role in influencing the short term variability of water vapour of upper troposphere. Ozone tongues caused by tropopause folding sometimes penetrates deep into the troposphere contributing to irreversible transport of chemicals outside the stratosphere. Despite decades of observation, the connections between tropopause folding and near-surface conditions are still not very well understood. According to the literature, there are only a few documented studies of stratospheric air intrusions which have been confirmed to proceed all the way down to the ground. This paper presents such a case of large intrusion of stratospheric air associated with tropopause folding which occurred over Eastern North America on March 14-15 2006 . This phenomenon has been investigated using global, regional and meso-scale models available at the Canadian Meteorological Center (CMC). These different models are generally successful for representing the significant transport of stratospheric air mass to the lower troposphere using various conservative quantities such as potential vorticity (PV) and different stratospheric constituents such as ozone. In particular, the results show the validity of using the ratio HNO3/O3 as a tracer for detecting fresh stratospheric intrusions. A general failure of these models is the representation of the strong dehydration which occurred near the surface behind the cold front following the touchdown of stratospheric air, a phenomenon well reported by surface observations. The observation network (METAR obs) indeed reports a large area of very low water vapour mixing ratio at the surface (with values in the range from 5.8 E-5 to 5.0E-4 kg/kg) which are coincident with higher levels of surface ozone considering the period of the year and the type of synoptic situation. Gusts in the range 40-50 kts were also reported in the context of this event. Such low water vapour mixing ratio corresponds to relative humidity of less than 10% near the surface. Those conditions lasted for a period of more than 6 hours over a large area of Southern US. Both observational and model evidence leave little doubt about the stratospheric origin of surface air mass. In this study, we analysed observational data and available model outputs from a multi-disciplinary point of view in relation with this event. MODEL AND ANALYSES OUTPUTS USED IN THIS STUDY: -CHRONOS: The Canadian Hemispheric and Regional Ozone and NOx System (CHRONOS) has been designed for the prediction of atmospheric oxidants on both regional and hemispheric scales. The original version of the system is described in Pudykiewicz et al. (1997). The model has been used for real-time forecasting in Canada. An Objective analysis (OA) combining this model output with AIRNOW-EPA surface ozone data is also available on a near real time basis (see figure 2). Details about this OA are given in Ménard and Robichaud (2005). -GEM Operational Model (Global, Environmental, Multiscale model, Coté et al, 1998) has a top at 10 hPa, a resolution of 15 km and 58 vertical levels for the regional configuration and a resolution of 0.9 deg with 28 vertical levels for the global configuration. The transport processes are computed by semi-Lagrangian scheme. This is the current global NWP forecast model used for meteorological operations at CMC (Canadian Meteorological Center). The global model has 4D-Var assimilation of meteorology and the regional version utilizes an ISBA land scheme for surface. -GEM-MSC-BIRA: This experimental version of GEM is a coupled meteorological-chemistry model with a lid at 0.1 hPa which is particularly suitable for the study of stratospheric phenomena. This model runs with an on-line photochemistry module developed at the Belgium Institute for Space Aeronomy (BIRA) which include 57 species and 200 photochemical reactions. Constituents are transported with a Semi-Lagrangian transport scheme (Coté et al., 1998) and initial conditions are obtained from ECMWF (for dynamic fields) and BIRA (for chemistry fields). The assimilation system which is based on 3D-VAR FGAT (three-dimensional variational analysis with first guess at appropriate time for dynamic assimilation) was run for two weeks before the event to insure consistency and avoid spin-up problems. No assimilation of ozone was performed in this case study. OBSERVATIONAL EVIDENCE OF THE TROPOPAUSE FOLDING EVENT AND ITS REFLECTION AT THE SURFACE FIGURE 1 FIGURE 2 FIGURE 3 FIGURE 4 OA CHRONOS CHRONOS MODEL OA L --- --- --- -- Cold front tropopause folding --- --- cold front Tropopause folding --- --- ANALYSIS INCREMENT OBS ANALYSIS INCREMENTS OBS surface cold front Figure 1 shows GOES-12 IR Satellite picture at 22:15Z on March 14 2006. A strong low pressure system whose center (L) is located NE of the Great Lakes with a well defined head and trailing cold front (reaching the Gulf of Mexico). This system is associated with the tropopause folding event ( see approximate position of the folding indicated by dashed lines which corresponds to the ‘hook’ pattern in the total column of ozone in figure 4). Behind the surface cold front, higher surface ozone levels were recorded which is an unusual location for an increase of surface ozone (figure 2, top right panel). The latter figure represents a special objective analysis (OA) based on a modified optimal interpolation technique. The OA is described in Ménard and Robichaud (2005), and combines CHRONOS model (top left) and real-time surface ozone data (AIRNOW-EPA on bottom right). Analysis increment (bottom left) shows a significant correction to the CHRONOS model behind the cold front at locations where stratospheric air is suspected to reach the surface (see deep blue area in figure 5). CHRONOS, the current Canadian prediction model of air quality (top left panel), could not capture the event since it does not provide any mechanism to take into account ozone intrusion of stratospheric origin. However, when assimilation of surface ozone is included (top right panel), the increase of ozone behind the front becomes realistic and resembles real observations (right bottom panel). Figure 3 reproduces the time series of relative humidity (RH) for different stations located behind the cold front (stations KHRJ, KJNX, KASJ are located in North Carolina, KVDI in Georgia and KHDO and KT82 in Texas). Surface METAR reports in different regions behind the cold front indicate RH readings near or below 10 % and with one automatic station reaching a dew point temperature below -40 deg. C (dry bulb temperature was 21 deg. C corresponding to RH of less than 1 %) . Figure 4 depicts a composite map of ozone total column from OMI instrument (AURA satellite) valid for March 14 2006. It is argued that the tropopause folding signature can be shown as a form of a ‘hook’ on the ozone total column (Olsen et al., 2000). Total ozone is the integral of the ozone profile through the whole atmospheric column. Ozone-rich stratospheric air descending at tropospheric locations will give a larger contribution to total ozone. MODEL EVIDENCE OF A TROPOPAUSE FOLDING AND OZONE DESCENT FIGURE 5 FIGURE 6 FIGURE 7 FIGURE 8 FIGURE 9 stratosphere ozone layer tropopause folding tropopause folding very dry area Tropopause folding (5-50 E-5 kg/kg) cross-section along this line Tongue of PV ozone tongue Ratio HNO3/O3 2000 km In the range 2-4E-3 Figures 5 to 9 show different model outputs and diagnosis during the afternoon of March 14th 2006. The cross sections of figure 6,7,8 and 9 were all taken along the arrow of figure 5 (roughly from South to North from Gulf of Mexico to Lake Superior) almost orthogonally to the cold front. Water vapour mixing ratio at about 800 hPa is shown on figure 5. Areas where water vapour mixing ratio is very small (5-50 E-5 kg/kg) has a great horizontal extent and is depicted by the deep-blue color in figure 5. Note that this area matches well the surface ozone analysis increment (bottom left panel of Fig. 2) indicating coincidence in ozone rise with the dehydration region. A cross-section of potential temperature is given on figure 6 showing approximately the trajectory of a dry adiabatic descending air parcel (roughly along lines of constant potential temperature). Figure 7 shows an analysis of Ertel`s potential vorticity (PV) clearly suggesting a large tropopause folding event . Areas of above 2PVU (1 PVU=10E-6 m2s-1K kg-1) indicates air of stratospheric origin (white area). PV is a surrogate for ozone to estimate its amount transported into the troposphere. Although model does not show that stratospheric air reaches the surface, it suggests some tendency for downward extent of a tongue in the PV field. Model diffusion prevents the tongue to reach the surface. Comparing figures 6 and 7 suggest that the descent took place roughly along isentropes in the range 295-300 deg. K. Figure 8 shows a cross-section output of the GEM-MSC-BIRA model ozone mixing ratio. Note that the top of this model is located at 0.1 mb (as compared with figures 5 to 7 for GEM Regional model with top at 10 hPa). Figure 8 indicates a similar downward extent but for the ozone tongue. Considerable dilution occurs due to mixing on its way through the troposphere so that the mixing ratio diminishes during the descent. Nevertheless, the dimension of the ozone tongue remains quite large and estimated to about 400-700 km wide at about 500 hPa. GEM-MSC-BIRA model which has a full on-line chemistry could simulate the ozone tongue down to just above the boundary layer. A similar kind of tongue can be distinguished for many other chemical species. However, the best tracer for stratospheric air intrusion seems to be the ratio HNO3/O3 (as suggested by Dibb et al., 2006 from aircraft measurements) who suggest that values of that ratio between 2 and 4 E-3 reveals a stratospheric signature. In Figure 9, we calculated this ratio from model outputs. Values within the critical range are indicated in orange and red and then indicate the clear signature of a deep and wide fresh stratospheric intrusion. VERTICAL PROFILES OF WATER VAPOUR MIXING RATIO SUMMARY AND CONCLUSIONS Measurements and model analyses show evidence of powerful tropopause folding event and associated exchange processes over Eastern North America on 14-15 March 2006. Models reproduce well the downward transport of semi-conservative quantities such as potential vorticity and stratospheric constituents such as ozone. The coupled meteorological-chemistry model (GEM-MSC-BIRA) is used to diagnose the transport of constituents from the ratio HNO3/O3 which appear as an excellent tracer for characterizing fresh stratospheric intrusion. In association with this effect, the model can represent the sudden increase of ozone behind cold front which has been observed from surface ozone networks. Models generally fail to represent the transport of low specific humidity (and other tracers) down to the surface which has been observed at various measurement sites. Surface relative humidity over many stations in SE US indicated values of RH near or below 10% for several hours with two sites recording RH of only few percent indicating that the stratospheric air reached the ground over a large area which is a rare event. This model deficiency can be due to several factors including excessive moisture fluxes from the surface and/or too active boundary layer mixing. Such studies can be particularly useful for model validation purpose. It also suggests that NWP and CTM models should include a stratospheric component in their formulation to be able to simulate tropopause folding events. A A B C A B C • REFERENCES • -Coté, J., S. Gravel, A. Méthot, A. Patoine, M. Roch, and A. Staniforth. The Operational CMC-MRB Global Environmental Multi-scale (GEM) Model. Part I: Design Considerations and formulation. Monthly Weather Review, 126, 1373-1395, 1998. • -Dibb J.E, Scheuer E., Talbot R. , 2006. Stratospheric influence on the composition of the mid and upper troposphere over North America sampled by the NASA DC-8 during INTEX A. Submitted to Journal of Geophysical Research, special section on INTEX A. • -Olsen, M. A., Gallus, W. A., Stanford, J. L., and Brown, J. M.: Fine scale comparison of TOMS total ozone data with model analysis on an intense mid-western cyclone, J. Geophys. Res., 105, 20487–20495, 2000. • - Ménard R., Robichaud A., 2005. The Chemistry-Forecast System at the Meteorological Service of Canada. Proceedings of ECMWF Seminar on Global earth-system monitoring, 5-9 September 2005. • Pudykiewicz J., A. Kallaur, and P.K. Smolarkiewicz, 1997. “Semi-Lagrangian modeling of tropospheric ozone. Tellus, 49B, 231-248. • ACKNOWLEDGMENTS. The first author wishes to thank R. Sauvageau of CMC (Canadian Meteorological Service) who extracted some of the data necessary for this case study , M. Charron who provided a computer program to calculate the Potential Vorticity and J. Pudykiewicz for some useful discussions. + + + Figure 10. Vertical profiles of water vapour mixing ratio from different models used at CMC. The profiles are all taken in the central part of North Carolina on March 15 00Z (in the region of very low RH, corresponding to the deep blue area of figure 5). All model forecasts correctly show very low water vapour mixing ratio (less than 1 E-3 kg/kg) from the stratosphere down to about 800 mb (that is about 0.8 in hybrid or sigma coordinate system). However, the boundary layer is too humid by about at least a factor of 2 or 3 (according to observations of water vapor mixing ratio reported on the graphs by a red cross) for GEM Regional model and almost one order of magnitude for global models. This is probably due to an inadequate soil moisture, a too active boundary layer, or some dynamic reasons. A. GEM-MSC-BIRA analysis valid at 00Z on March analysis with 3DVAR-FGAT assimilation and with a stratosphere, B. GEM Global with 4DVAR met. assimilation with force-restore for land scheme and no stratosphere, C. High resolution regional GEM analysis with 3D-VAR capabilities, with no stratosphere and ISBA for land surface scheme. Note that vertical profiles at other locations and other time (15Z,18Z and 21Z) have shown similar results. Corresponding author: Alain Robichaud (alain.robichaud@ec.gc.ca)