Download
1 / 118
1.18k likes | 1.35k Views
Making Lemonade Lemons out of Lemons By: Jim Rounds Senior V.P., Elliott D. Pollack & Company. The economy’s impact on:. Your job? Your home? Your future?. U.S. Summary. U.S. Y/Y Job Losses - Recent Recessions Duration in Months – BLS - May. 2001. 1991. 1980/81. 1974.

E N D
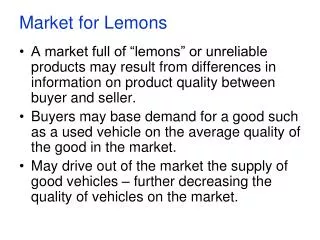
Making Lemonade Lemons out of Lemons By: Jim Rounds Senior V.P., Elliott D. Pollack & Company
The economy’s impact on: • Your job? • Your home? • Your future?
U.S. Y/Y Job Losses - Recent RecessionsDuration in Months – BLS - May 2001 1991 1980/81 1974
US New Job Data Change from Prior Month (S/A)June 2010 - June 2011Source: Bureau Labor of Statistics (000’s) ?
Recession Indicators Summary:Still Moving Upward(Just Slowly) • Real GDP • Real Income • Employment • Industrial Production • Wholesale – Retail Sales
Recession Periods Household Net Worth ($$$)1970 – 2010*Source: Federal Reserve ($ in trillions) But still feel poor… • Data through fourth quarter 2010.
Consumer Confidence1978 – 2011* Source: The Dismal Scientist Recession Periods 1985 Benchmark = 100 *Data through March 2011
Consumer Summary: • Jobs are being created but not quickly enough. • Those that have jobs are spending a little more but will remain cautious. • Most of those that don’t have jobs probably won’t anytime soon. • Wealth levels are improving but people still feel poor. • Congress and the President have done little to positively influence confidence.
Recession Periods Corporate Profit (Billions of Dollars, SA) 1975-2010*Source: Freelunch.com *Data through fourth quarter 2010
U.S. Real Exports as a Percent of Real GDP1971 – 2010* Source: Bureau of Economic Analysis Recession Periods *Data through fourth quarter 2010
Hours WorkedPercent Change from Year Ago1976 – 2010** Source: Bureau of Labor Statistics Recession Periods **Data through fourth quarter 2010
Capacity Utilization Rate1970 – 2011* Source: The Conference Board Recession Periods This is where investment occurs. *Data through February 2011
Business Summary: • Profits are high, but… • Business spending on plant will be slow, but getting closer to seeing some limited investment. • Hiring will still be relatively slow, but more pressure to hire by the end of the year. • Lots of money sitting on the sidelines.
U.S. Summary:Recovering but not recovered.Lots of small shocks thus far but none have been game changers (oil spikes, Middle East, Japan, etc.)Debt Ceiling???
Alaska Hawaii Jobs growing Top 10 Jobs declining Job Growth 2006 Source: US BLS 10 7 9 5 1 4 3 15 22 8 2 11 6 13
Alaska Hawaii Jobs growing Top 10 Jobs declining Job Growth 2007 Source: US BLS 7 8 15 5 11 2 28 1 10 36 6 22 20 9 4 3 45
Hawaii Jobs growing Top 10 Jobs declining Job Growth 2008 Source: US BLS Alaska 8 15 2 34 42 7 1 11 46 17 10 45 9 4 47 14 3 6 50
Hawaii Jobs growing Top 10 Jobs declining Job Growth 2009 Alaska 2 Source: US BLS 30 18 1 47 44 3 23 5 50 35 32 45 13 16 49 24 8 4 46
Hawaii Jobs growing Top 10 Jobs declining Job Growth 2010 Alaska 2 6 48 17 1 28 40 12 10 43 5 19 9 50 4 25 7 38 44 47 8 35 49 42 3 37
Hawaii Jobs growing Top 10 Jobs declining Job Growth Update: Arizona Ranked 36th May 2011 v May 2010 Alaska 11 18 34 1 22 7 33 38 9 4 3 46 8 10 5 23 13 39 45 36 6 50 2 37
How did AZ go from 2nd to 49th? Financial meltdown. Credit crunch/freeze. Overextended consumer. Excess single family inventory. Housing prices decline. • Loss of wealth incl. home equity. • Can’t sell homes or retire. • Homebuilding crash. • Population inflows weaken in AZ. • Household formations decline. • Household size increases. • Excess commercial construction • Construction job losses. • All sector job loses.
How does AZ go from 49th to 2nd? Slow recovery. Credit frees up slowly. Consumers more confident. • Overall US economy improves. • Stock market improves. • Limited AZ job and population growth. • Excess housing absorbed. • Smaller household size. • Housing prices rise. • Construction kicks in. • All sector job gains; more robust %s. • Even more people move to AZ.
Recession Periods Greater Phoenix Population Annual Percent Change 1976–2012*Source: Arizona State University & Department of Commerce, Research Administration ? 2008 and 2009 are estimates put out by ADES and may be subject to substantial revision. * 2011 & 2012 forecast is from Elliott D. Pollack & Co. *2000-2010 estimates based on 2010 Census release
Greater Phoenix Y/Y Job Losses - Recent RecessionsDuration in Months – BLS - April 1991 1980/81 2001 = Job Growth 1974
AZ New Job Data Change from Prior Month (S/A)May 2010 - May 2011Source: Bureau Labor of Statistics (000’s) About 2k not S/A
Recession Periods Greater Phoenix Employment* Annual Percent Change 1975–2012**Source: Department of Commerce, Research Administration *Non-agricultural wage & salary employment. Changed from SIC to NAICS reporting in 1990. ** 2011& 2012 forecast is from Elliott D. Pollack & Co.
This is NOT a multi decade recovery… Think 2015 – 2016 for full recovery, but growth before then.
Recession Periods Employment Levels: Greater Phoenix back to Peak in 2015?Source: ADOC Peak
Across the US, underproduction has been occurring. This helps with the oversupply.
Recession Periods U.S. Single-Family Starts1978–20111/Source: Census Bureau (Millions) Over- supply LTA: 1.2 Under- supply 1/ Through Febuary 2011
In AZ, because of the weak population inflows, this underproduction only recently started.
Single-Family Permits vs. Population DemandGreater Phoenix 1975–2015Source: PMHS / RL Brown Recession Periods # Permits * 2011 - 2015 forecast is from Elliott D. Pollack & Co.
Single-Family Vacant UnitsMaricopa County 1993–2010Source: PMHS
How Investors Impact the Market: Investors temporarily create demand. How many of those homes will come back on the market and add to the supply? But, how many will be kept as permanent rental units or purchased by current renters?
Home Prices Indices2000 – 2011 (January) Source: Macro Markets, LLC; AMLS Recession Periods Weak Pop/Emp ? Investors
Negative Equity in Homes Affects Ability to Sell or BuySource: First American Core Logic 50% of homes in Arizona have negative equity.
Household Formations Fewer during recessions (doubling up, living at home with mom & dad, etc).
Persons per HHSource: U.S. Census Bureau & American Community Survey
Commercial Markets (Not making things worse anymore)