Section 6.5 Graphing Linear Inequalities in Two Variables
90 likes | 363 Views
Section 6.5 Graphing Linear Inequalities in Two Variables. Objectives: Graph a linear inequality in two variables Model a real-life situation using a linear inequality in two variables. Graph of a linear inequality in two variables.

Section 6.5 Graphing Linear Inequalities in Two Variables
E N D
Presentation Transcript
Section 6.5Graphing Linear Inequalities in Two Variables Objectives: Graph a linear inequality in two variables Model a real-life situation using a linear inequality in two variables
Graph of a linear inequality in two variables • The graph of all ordered pairs that are solutions of the inequality. • An ordered pair is a solution of a linear inequality if the inequality is true when the values of x and y are substituted into the inequality. • Every point in the shaded region is a solution of the inequality.
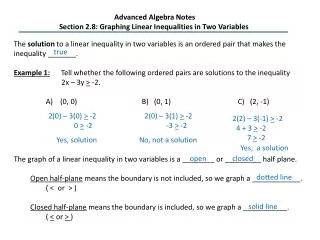
Graphing a Linear Inequality • Step 1: Graph the equation. Use a dashed line for inequalities with < or > to show that the points on the line are not solutions. Use a solid line for inequalities with to show that the points on the line are solutions. • Step 2: The line you drew separates the coordinate plane into two half-planes. Test a point in one of the half-planes to find whether it is a solution of the inequality. • Step 3: If the test point is a solution, shade the half-plane it is in. If not, shade the other half-plane.
EX: Football • In the last quarter of a high school football game, your team is behind by 21 points. Let x represent the number of field goals scored and y represent the number of touchdowns scored. Write and graph an inequality that models the different numbers of field goals and touchdowns your team could score and still not win or tie. (Assume the other team scores no more points)
6.5 p. 36315 – 63x3, 64, 66, 70,80 – 90 evens 26 questions