Download
1 / 18
180 likes | 335 Views
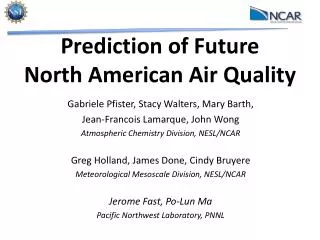
Prediction of Future North American Air Quality. Gabriele Pfister, Stacy Walters, Mary Barth, Jean-Francois Lamarque, John Wong Atmospheric Chemistry Division, NESL/NCAR Greg Holland, James Done, Cindy Bruyere Meteorological Mesoscale Division, NESL/NCAR Jerome Fast, Po- Lun Ma

E N D
Prediction of Future North American Air Quality Gabriele Pfister, Stacy Walters, Mary Barth, Jean-Francois Lamarque, John Wong Atmospheric Chemistry Division, NESL/NCAR Greg Holland, James Done, Cindy Bruyere Meteorological Mesoscale Division, NESL/NCAR Jerome Fast, Po-Lun Ma Pacific Northwest Laboratory, PNNL
Objectives “There is growing recognition that development of optimalcontrol strategies for key pollutants like O3 and PM2.5 requires assessment of potential future climate conditions and their influence on the attainment of air quality objectives” • Future changes in weather and air quality over North America • Effects of changing emissions and changing climate on AQ • Feedbacks between chemistry and climate • Differences in climate metrics when downscaling fromglobal or larger scale simulations with different physics • Sensitivity of predictions to initial conditions NSF EASM - Developing a Next-Generation Approach to Regional Climate Prediction at High Resolution (PI Greg Holland) NCAR ASD - Accelerated Scientific Discovery Proposal 2012 (PI Gabriele Pfister)
WRF-Chem Setup as NRCM-Chem • 13 years present (1996-2007) and future (2046-2057) • Season: 1 April – 1 Oct • 12 x 12 km2(697 x 394); 51 vertical levels (up to 10 hPA) • Gas-Phase Scheme: Reduced Hydrocarbon Scheme (40 species) • Aerosols: Modal Aerosol Model (MAM; 33 species, +SOA) • Direct/indirect aerosol effects • CAM-5 microphysics and PBL Scheme • IPCC A2 Climate Scenario, RCP8.5 Emission Scenario 10 years + 3years/simulation with initial start date changed
WRF-Chem Setup as NRCM-Chem • Meteorological IC & BC • Downscaled from NRCM-Met @ 36 x 36 km2 [Done et al., 2012] • Chemical IC & BC • CAM-Chem RCP 8.5 [Lamarque et al., 2011] • Monthly means for 2000 and 2050 • Upper Chemical Boundary Conditions for O3, N2O, ... Done, et al. (2012), Modeling high-impact weather and climate: Lessons from a tropical cyclone perspective. NCAR/TN-490+STR, 28pp. • Done et al. (2012): Modeling high-impact weather and climate, NCAR/TN-490+STR, 28pp. Lamarque et al.,(2011), Climatic Change, 109(1-2), 191-212, doi:10.1007/s10584-011-0155-0.
WRF-Chem Setup as NRCM-Chem - Emissions • IPCC RCP 8.5 Scenario: NOx emissions reduced by -60% over domain (-10% globally) by 2050 • Start with global 0.5° IPCC emissions used in CAM-Chem re-grid in 2° x 2° segments to 0.1° using EDGAR-4.1# spatial distribution mass-conserving mapping to NRCM-Chem domain Global Emissions 0.5° NRCM-Chem 12 km EPA NEI 2005 4km->12km # http://edgar.jrc.ec.europa.eu
WRF-Chem Setup as NRCM-Chem - Emissions Fires: • NCAR Fire Model FINN • 10-year Climatology • Same for Present & Future Biogenic: • Online MEGAN • No change in land cover/use • Radiation and T dependence • LAI, TS and PAR climatology for plant history NO Fire Emissions - Time Series Isoprene Emissions, July present
Present Time Surface Ozone – Obs and Model Average Diurnal Cycle Correlation 17±16 ppbV 57±21 ppbV Mean for 12-18 LT & 0-4 LT 22±16 ppbV 51±21 ppbV EPA Data: 1996-2005
Prediction of Future Surface Ozone Daily maximum hourly surface ozone for JJA Present Future (Climate+Emis) - Present Regional Emissions + Climate+Background Future (Climate+Emis) Future (Climate) - Present Climate+Background Future (Climate) Future (Climate+Emis) – Future (Emis) Regional Emissions
Average #Days with 8-hr Ozone Exceedance 75 ppbV 65 ppbV Present Future (Climate + Emissions) -98% -99% Future (Climate) +45% +64%
Meteorological Drivers of Ozone Change (Present) SW Downward Radiation (Future-Present) (Present) Surface Temperature (Future-Present) (Present) Biogenic Isoprene Emissions (Future-Present) 16.4 18.7 TgC
Meteorological Drivers of Ozone Change (Present) Boundary Layer Height (Future-Present) (Present) Wind Speed (Future-Present) (Present) #Stagnation Days (Future-Present)
Long Range Transport and Background Ozone CAM-Chem Present Time Surface Ozone (16-22 UTC) Future - Present
Global and Regional Predictions Present Future-Present NRCM-Chem CAM-Chem
Global andRegional Predictions Present Future-Present NRCM-Chem CAM-Chem
Global andRegional Predictions Present Future-Present NRCM-Chem CAM-Chem
Summary & Outlook • Simulations address range of interesting science topics: • Future Changes in Air Quality – Impacts of Climate and Emissions • Future Changes in Climate • Dynamical Downscaling of Meteorology and Chemistry • Chemistry-Climate Feedbacks • Sensitivity to Initial Conditions • etc. etc. etc. • First Analysis: • Reducing surface Ozone over the U.S. can be achieved by strong emission reductions, while the impacts of climate act to increase surface ozone by 2050 in parts due to increased temperature, solar radiation and stagnation eventsand higher background levels.
Objectives “There is growing recognition that development of optimalcontrol strategies for key pollutants like O3 and PM2.5 requires assessment of potential future climate conditions and their influence on the attainment of air quality objectives” Average number of days (%) during May-Sep 1995-2000 and 2005-2010 when the 8-hour ozone NAAQS of 75 ppbV was exceeded. (EPA Monitoring Network)