Download

1 / 52
520 likes | 635 Views
The National Atmospheric Deposition Program (NADP) Project. Presented by Xuan Bi, Qi Wang and Weixin Wu. Acknowledgement. Christopher Lehmann Director, Central Analytical Laboratory Mark F Rhodes Quality Assurance Manager. Agenda. NADP Background Project Goals

E N D
The National Atmospheric Deposition Program (NADP) Project Presented by Xuan Bi, Qi Wang and Weixin Wu
Acknowledgement Christopher Lehmann Director, Central Analytical Laboratory Mark F Rhodes Quality Assurance Manager
Agenda NADP Background Project Goals Data Analyses Conclusions
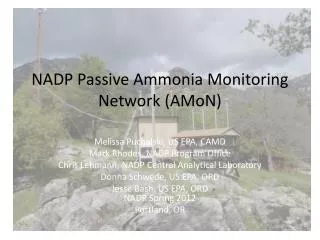
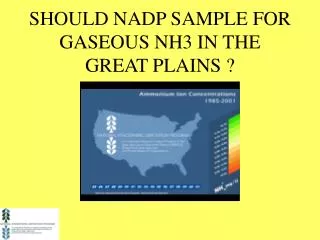
NADP Background Measure atmospheric deposition Study its effects on the environment 5 Networks: NTN, AIRMoN, MDN, AMNet, and AMoN ~400 stations 370,700 samples from the longest running network (NTN)
Project Goal • Part 2(Metra East St. Louis Citizens Air Project): Rank 25 locations in Granite City, IL by NO2 and SO2 Part 1: Compare NTN and CAPMoN weekly data (PA15)
Project Goal • Part 2(Metra East St. Louis Citizens Air Project): Rank 25 locations in Granite City, IL by NO2 and SO2 Part 1: Compare NTN and CAPMoN weekly data (PA15)
Part 1 Compare NTN and CAPMoN weekly data (PA15) NTN Raw Data
Part 1 Compare NTN and CAPMoN weekly data (PA15) CAPMoN Raw Data
Part 1 – SO4 Compare NTN and CAPMoN weekly data (PA15) Correlation = 0.9606
Part 1 – SO4 Compare NTN and CAPMoN weekly data (PA15)
Part 1 – SO4 Compare NTN and CAPMoN weekly data (PA15)
Part 1 – SO4 Compare NTN and CAPMoN weekly data (PA15) Recap: Remove invalid observations in NTN data Match dates between NTN and CAPMoN data Run a linear regression on the difference between CAPMoN and NTN Next Step: 4. Detect a seasonal trend of the difference between CAPMoN and NTN
Part 1 – Q2 Compare NTN and CAPMoN weekly data (PA15) – SO4 The autocorrelation is high. y(t)=x(t)-x(t-1)
Part 1 Compare NTN and CAPMoN weekly data (PA15) – SO4 When selecting models, we referred to AIC, BIC, AICC criteria, ran EACF, and looked at the plot of ACF, PACF. SARIMA (0, 0, 1, 1, 0, 1, 13)
Part 1 Compare NTN and CAPMoN weekly data (PA15) – SO4 The coefficients are more than 20 times of their standard errors.
Part 1 – SO4 Compare NTN and CAPMoN weekly data (PA15) SARIMA (0, 0, 1, 1, 0, 1, 13) model has non-correlated residuals.
Part 1 – SO4 Compare NTN and CAPMoN weekly data (PA15) Cycle = 13, 14, …,18 all pass the Ljung-Box correlation test. Cycle = 13 has the lowest BIC value.
Part 1 – SO4 Compare NTN and CAPMoN weekly data (PA15) Our conclusion for SO4: The difference between CAPMoN data and NTN data is 0.1514, with a cycle of a quarter (13 weeks)
Part 1 – NO3 Compare NTN and CAPMoN weekly data (PA15) Correlation = 0.9296
Part 1 – NO3 Compare NTN and CAPMoN weekly data (PA15) None of the SARIMA models can both pass the Ljung-Box correlation test, and have significant coefficients. ARIMA(1,1,2) model without seasonal trend can fit the data well The coefficients are more than 5 times of their standard errors.
Part 1 – NO3 Compare NTN and CAPMoN weekly data (PA15) ARIMA(1,1,2) model may have correlated residuals.
Part 1 – NO3 Compare NTN and CAPMoN weekly data (PA15) ARIMA(1,1,2) passes the Ljung-Box correlation test.
Part 1 – NO3 Compare NTN and CAPMoN weekly data (PA15) Our conclusion for NO3: The difference between CAPMoN data and NTN data is 0.3984, with no seasonal trend.
Part 1 – NH4 Compare NTN and CAPMoN weekly data (PA15) Correlation = 0.8434
Part 1 – NH4 Compare NTN and CAPMoN weekly data (PA15) None of the SARIMA models can both pass the Ljung-Box correlation test, and have significant coefficients. ARIMA(0,1,1) model has significant coefficients but cannot pass the Ljung-Box test. The coefficients are more than 100 times of their standard errors.
Part 1 – NH4 Compare NTN and CAPMoN weekly data (PA15) ARIMA(0,1,1) model may have correlated residuals.
Part 1 – NH4 Compare NTN and CAPMoN weekly data (PA15) ARIMA(0,1,1) cannot pass the Ljung-Box correlation test.
Part 1 – NH4 Compare NTN and CAPMoN weekly data (PA15) Our conclusion for NH4: The difference between CAPMoN data and NTN data is 0.0964 and seasonal trend can not be detected.
Part 1 Compare NTN and CAPMoN weekly data (PA15)
Project Goal • Part 2(Metra East St. Louis Citizens Air Project): Rank 25 locations in Granite City, IL by NO2 and SO2 Part 1: Compare NTN and CAPMoN weekly data (PA15)
Part 2 Rank 25 locations in Granite City, IL by NO2
Part 2 Rank 25 locations in Granite City, IL by NO2 • Most of the subjects have a significant trend that goes down at the 2nd and 4th time points and goes up at the 3rd and 5th. Therefore, ranking by averaging the 5 time points means ignoring the trend. • We can hardly find any subject that has its NO2 concentration uniformly above another at all time. Therefore, we cannot determine the ranking by looking through them manually.
Part 2 Rank 25 locations in Granite City, IL Longitudinal data Principle Component Analysis No explanatory variables Only response variables Correlated data points
Part 2 Rank 25 locations in Granite City, IL Principle Component Analysis PCA is a dimension reduction method that creates variables called principal components. Most of the variability in the original data can be retained.
Part 2 Rank 25 locations in Granite City, IL by NO2
Part 2 Rank 25 locations in Granite City, IL by NO2 Lower Higher
Part 2 Rank 25 locations in Granite City, IL by SO2
Part 2 Rank 25 locations in Granite City, IL by SO2 • Most of the subjects have a significant trend that goes down at the 3rd and 5th time points and goes up at the 2nd and 4th. Therefore, ranking by averaging the 5 time points means ignoring the trend. • We can hardly find any subject that has its SO2 concentration uniformly above another at all time. Therefore, we cannot determine the ranking by looking through them manually.
Part 2 Rank 25 locations in Granite City, IL by SO2
Part 2 Rank 25 locations in Granite City, IL by SO2 Lower Higher
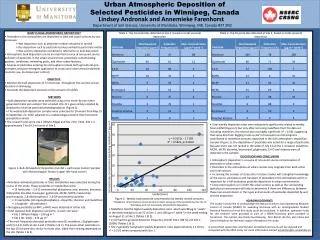
Part 2 Relationship between NO2 concentration & average distance to major roads Linear Regression Correlation Conclusion: there is a negative correlation between the NO2 concentration and the distance to major roads.
Part 2 Relationship between NO2 ranking & average distance to major roads Linear Regression Conclusion: there is a negative relationship between the NO2 ranking and the distance to major roads.
Part 2 Relationship between SO2 concentration & average distance to major roads Linear Regression Correlation Conclusion: there is no significant correlation between the SO2 concentration and the distance to major roads.
US Steel Granite City: the most major source of SO2. AvgDistRoad: the average of the distances from sites to major roads. AvgDistSource: the average of the distances from sites to other major sources. How to fix the missing data: in the distance data set, we treated the missing values as infinite distances. We took inverse of the original data, and thus the infinite distances are transformed to zero. And we will use the inversed data for regression.
Part 2 Relationship between SO2 ranking & average distance to SO2 source Linear Regression Conclusion: the SO2 ranking is inversely proportional to the distance to SO2 source.