Download
1 / 45
470 likes | 683 Views
The National Atmospheric Deposition Program (NADP) Chris Lehmann & Mark Rhodes Illinois State Water Survey Sotiria Koloutsou-Vakakis Dept. of Civil and Environmental Engineering. Who Are We?. Chris Lehmann, Director, Central Analytical Laboratory for the NADP

E N D
The National Atmospheric Deposition Program (NADP) Chris Lehmann & Mark Rhodes Illinois State Water Survey Sotiria Koloutsou-Vakakis Dept. of Civil and Environmental Engineering
Who Are We? Chris Lehmann, Director, Central Analytical Laboratory for the NADP Mark Rhodes, Quality Assurance Manager, NADP Sotiria Koloutsou-Vakakis, Research Scientist, Dept. Civil & Environmental Engineering
NADP Overview • Nationwide network of precipitation (rain & snow) and air quality monitoring sites • ~370 stations in 3 networks • 1 analytical laboratory, here on campus • 33+ year history • 357,740 samples from longest running network • All data available via the Internet at http://nadp.isws.illinois.edu
Atmospheric Deposition REMOVAL ATMOSPHERIC TRANSPORT & TRANSFORMATION REACTIONS GAS/PARTICULATE PHASE AEROSOL PARTICLES & GASES AQUEOUS PHASE PRECIPITATION Wet Deposition Dry Deposition ADVERSE ENVIRONMENTAL EFFECTS EMISSIONS
Why are we here? We have lots of data and we need your help to interpret it!
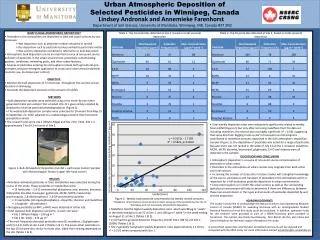
Our Questions (I) • Triplicate passive-type air samplers are deployed at selected sites for quality assurance. How well do the values agree, and is there a trend in agreement over time? Might triplicate variability correlate with other variables (temperature, wind speed, sampler reuse, etc.)?
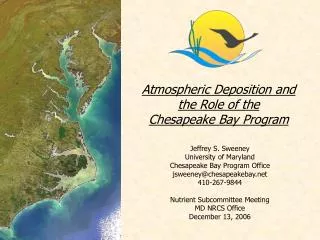
Our Questions (II) • We have estimates of air pollutant emissions, which are expressed on a county-level or grid basis. How can we correlate this spatial-scale data with our air quality point measurements?
Our Questions (III) • How should we correlate estimated ammonia emissions (on a spatial scale), with other independent variables at similar (or differing) spatial resolutions. Such variables include land use, soil types, wind speed, and temperature.
Ammonium Concentration Trends 3-year running average 1985 – 2008
1984 1986 Ammonium Ion Concentrations 1985-2008 1985
1985 1987 Ammonium Ion Concentrations 1985-2008 1986
1986 1988 Ammonium Ion Concentrations 1985-2008 1987
1987 1989 Ammonium Ion Concentrations 1985-2008 1988
1988 1990 Ammonium Ion Concentrations 1985-2008 1989
1989 1991 Ammonium Ion Concentrations 1985-2008 1990
1990 1992 Ammonium Ion Concentrations 1985-2008 1991
1991 1993 Ammonium Ion Concentrations 1985-2008 1992
1992 1994 Ammonium Ion Concentrations 1985-2008 1993
1993 1995 Ammonium Ion Concentrations 1985-2008 1994
1994 1996 Ammonium Ion Concentrations 1985-2008 1995
1995 1997 Ammonium Ion Concentrations 1985-2008 1996
1996 1998 Ammonium Ion Concentrations 1985-2008 1997
1997 1999 Ammonium Ion Concentrations 1985-2008 1998
1998 2000 Ammonium Ion Concentrations 1985-2008 1999
1999 2001 Ammonium Ion Concentrations 1985-2008 2000
2000 2002 Ammonium Ion Concentrations 1985-2008 2001
2001 2003 Ammonium Ion Concentrations 1985-2008 2002
2002 2004 Ammonium Ion Concentrations 1985-2008 2003
2003 2005 Ammonium Ion Concentrations 1985-2008 2004
2004 2006 Ammonium Ion Concentrations 1985-2008 2005
2005 2007 Ammonium Ion Concentrations 1985-2008 2006
2006 2008 Ammonium Ion Concentrations 1985-2008 2007
2007 2009 Ammonium Ion Concentrations 1985-2008 2008
1984 1986 Ammonium Ion Concentrations 1985-2008 1985
Back to our Questions… • Triplicate passive-type air samplers are deployed at selected sites for quality assurance. How well do the values agree, and is there a trend in agreement over time? Might triplicate variability correlate with other variables (temperature, wind speed, sampler reuse, etc.)?
Our Questions… • We have estimates of air pollutant emissions, which are expressed on a county-level or grid basis. How can we spatially correlate this spatial-scale data with our air quality point measurements?
Our Questions (III) • How should we correlate estimated ammonia emissions (on a spatial scale), with other independent variables at similar (or differing) spatial resolutions. Such variables include land use, soil types, wind speed, and temperature.
Location of additional files nadp.isws.illinois.edu/dl/STAT427/2012/
Questions? OUR X