Download

1 / 53
530 likes | 666 Views
Hydrologic Measurement. Precipitation Evaporation Streamflow Channel Properties Topography GIS datasets. Reading: Applied Hydrology Chapter 6. Hydrologic Measurement. Water Quality Sampling. Precipitation, Climate, Stream Gaging. Precipitation Station. Tipping Bucket Raingage

E N D
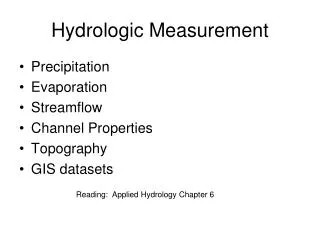
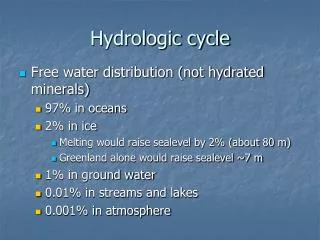
Hydrologic Measurement • Precipitation • Evaporation • Streamflow • Channel Properties • Topography • GIS datasets Reading: Applied Hydrology Chapter 6
Hydrologic Measurement Water Quality Sampling Precipitation, Climate, Stream Gaging
Precipitation Station • Tipping Bucket Raingage • The gauge registers precipitation (rainfall) by counting small increments of rain collected. • When rain falls into the funnel it runs into a container divided into two equal compartments by a partition • When a specified amount of rain has drained from the funnel the bucket tilts the opposite way. • The number and rate of bucket movements are counted and logged electronically.
Weather/climate station • Following variables are recorded • Wind velocity/direction • Rainfall • Relative humidity and temperature • Radiation
Components of a weather station Anemometer Tipping bucket raingage Radiometer Relative humidity and temperature
Precipitation (continued) • Snow Pillows http://wsoweb.ladwp.com/Aqueduct/snow/pillow.htm
Streamflow using a boat Tag line
Measurement at high flows Using stream gaging cable car From bridge
Water Surface Height above bed Depth Averaged Velocity Velocity Stream Flow Rate Velocity profile in stream Discharge at a cross-section
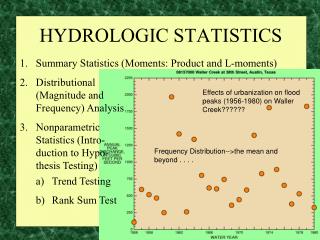
Example Colorado River at Austin
Example (Cont.) Q = 3061 ft3/s V = Q/A = 1.81 ft/s
Rating Curve • It is not feasible to measure flow daily. • Rating curves are used to estimate flow from stage data • Rating curve defines stage/streamflow relationship http://nwis.waterdata.usgs.gov/nwis/measurements/?site_no=08158000
Water Watch http://waterwatch.usgs.gov/new/
Improvements from Senate Bill 2:Instream Flow requirements • Requires TPWD, TWDB, TCEQ to develop procedures for defining instream flow requirements • Implemented on priority study regions by 2010 • Based on fish habitat analysis Trinity Brazos Sabine Guadalupe San Antonio Priority Study Regions
Criterion Depth & velocity Species groups Habitat Hydrodynamic Habitat SMS/RMA2 Data Collection and some statistics Model Model Descriptions ArcGIS Instream Flow DecisionMaking Process Flowchart
Study Area (Guadalupe river near Seguin, TX) 1/2 meter Digital Ortho Photography
Depth Sounder (Echo Sounder) The electronic depth sounder operates in a similar way to radar It sends out an electronic pulse which echoes back from the bed. The echo is timed electronically and transposed into a reading of the depth of water.
Acoustic Doppler Current Profiler Provides full profiles of water current speed and direction in the ocean, rivers, and lakes. Also used for discharge, scour and river bed topography.
Measurement System GPS Antenna Computer and power setup Depth Sounder
Bathymetry from Side-Scanning Sonar Channel demo
Digital Elevation Model with 1 arc-second (30m) cells Seamless in 1° blocks for the United States 10 billion data Derived from USGS 1:24,000 quadrangle sheets Get the data: http://seamless.usgs.gov/ National Elevation Dataset http://ned.usgs.gov/
Digital Elevation Model (DEM) 720 720 Contours 740 720 700 680 740 720 700 680
32 64 128 16 1 8 4 2 Eight Direction Pour Point Model Water flows in the direction of steepest descent
32 64 128 16 1 8 4 2 Flow Direction Grid
Watersheds of the US 2-digit water resource regions 8-digit HUC watersheds
Hydrologic Unit Code Watersheds ~ 2000 for US, about the size of counties
LIDAR surveying LIDAR (Light Detection and Ranging; or Laser Imaging Detection and Ranging) is a technology that determines distance to an object or surface using laser pulses. Like the similar radar technology, which uses radio waves instead of light, the range to an object is determined by measuring the time delay between transmission of a pulse and detection of the reflected signal.
3-D detail of the Tongue river at the WY/Mont border from LIDAR. Roberto Gutierrez University of Texas at Austin
HydroSheds derived from SRTM http://hydrosheds.cr.usgs.gov/
River networks for 8-digit HUC watersheds http://nhd.usgs.gov/
Lower West Fork, Trinity River Basin HUC = 12030102
NHDPlus for a Portion of Oregon http://www.horizon-systems.com/nhdplus/
NHDPlus Reach Catchments ~ 3km2 Average reach length = 2km 2.3 million reaches for continental US About 1000 reach catchments in each 8-digit HUC
1:250,000 Scale Soil Information http://www.ncgc.nrcs.usda.gov/products/datasets/statsgo/