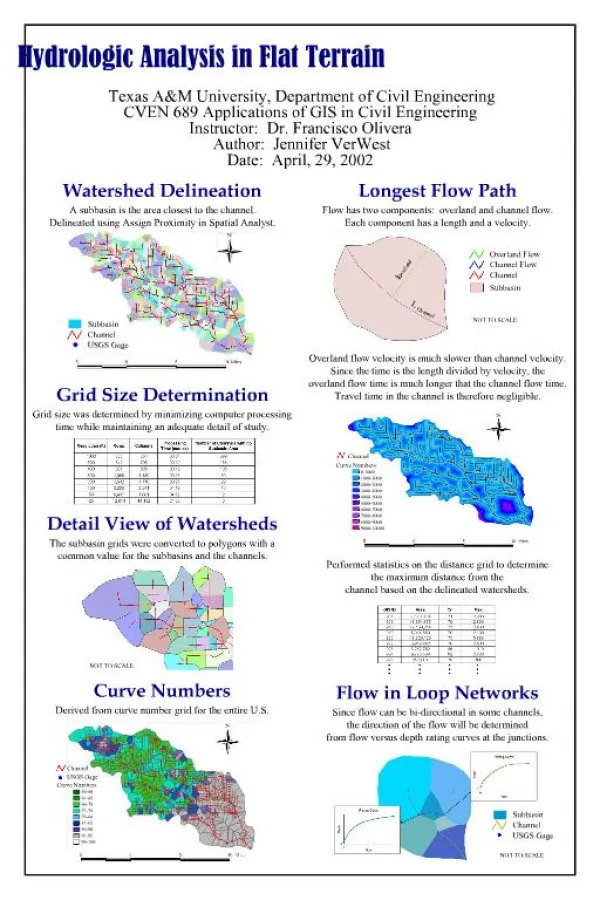
Hydrologic Analysis
Hydrologic Analysis. Dr. Bedient CEVE 101 Fall 2013. Review. A watershed- a basic unit used in most hydrologic calculations relating to the water balance or computation of rainfall-runoff Watershed Response-how the watershed response to rainfall. Several characteristics will effect response

Hydrologic Analysis
E N D
Presentation Transcript
Hydrologic Analysis Dr. Bedient CEVE 101 Fall 2013
Review • A watershed- a basic unit used in most hydrologic calculations relating to the water balance or computation of rainfall-runoff • Watershed Response-how the watershed response to rainfall. Several characteristics will effect response • Drainage Area • Channel Slope • Soil Types • Land Use • Land Cover • Main channel and tributary characteristics-channel morphology • The shape, slope and character of the floodplain • There is a way to plot the flow from the outlet over a space of time. This graphical representation is called a hydrograph
Typical Graphs for Hydrologic Analysis Hydrograph Hyetograph Cummulative Rainfall
Hydrographs Hydrograph: continuous plot of instantaneous discharge • Flow rate (cfs or cms) vs. time • Watershed factors of importance: • Size and shape of drainage area • Slope of the land surface and the main channel • Soil types and distribution in watershed • Meteorological Factors that influence the shape and volume of runoff: • Rainfall intensity and pattern • Areal distribution of rainfall over the basin • Size and duration of the storm event
Hurricane Ike (September 13) and FAS2 Prediction • Made by Nick FANG at the Phil Bedient Water Resources Research Group at Rice University.
Typical Hydrographs • Rising limb • Crest segment • Recessive curve • Falling limb • Base Flow
The Watershed Response Hydrograph • As rain falls over a watershed area, a certain portion will infiltrate the soil. Some water will evaporate to atmosphere. • Rainfall that does not infiltrate or evaporate is available as overland flow and runs off to the nearest stream. • Smaller tributaries or streams then begin to flow and contribute their load to the main channel at confluences. • As accumulation continues, the streamflow rises to a maximum (peak flow) and a flood wave moves downstream through the main channel. • The flow eventually recedes or subsides as all areas drain out.
Hyetograph • Graph showing rainfall intensity vs time (in./hr) • Can be calculated if given cumulative rainfall (P) or gross rainfall (I)
Example of plotting hyetographs and rainfall • For the rainfall given below, plot cumulative rainfall (P) and gross rainfall hyetograph with ∆t = 30 min.
Example of plotting hyetograph and rainfall • We are given gross rainfall, to find cumulative rainfall you need to take rainfall from each time step and you add it to the previous time step’s result so • 0 + 0 (I0) = 0 • 0+ 0.2 (I1)= 0.2 • 0.2 + 0.1(I2) = 0.3 • 0.3+ 0.3 (I3)= 0.6 The resulting table will be To go from P to I you take your rainfall at a time step and subtract the previous time step-try it and see if you get the same results.
Example of plotting hyetograph and rainfall • To plot rainfall intensity (in./hr) you take your gross rainfall (I) and divide it by your time step (30 min = 0.5 hr) • 0 / 0.5 = 0 in/hr • 0.2 / 0.5 = 0.4 in/hr • 0.1 / 0.5 = 0.2 in/hr • 0.3 / 0.5 = 0.6 in/hr
Determining volume of runoff • The volume of runoff from a watershed is equal to the area under the hydrograph. • In graph form, an approximation can be made by which estimates the volume as a bar graph. Each individual bar is then added to give volume. • In table form, this is done by multiplying flow (Q) by the time step. • This is summarized in the next example.
Example of determine total volume of runoff • Given the hydrograph, determine the total volume of runoff for a 2600 acres-basin. Adapted from Bedient et al, Hydrology and floodplain analysis, 4th ed. Example 2-1
Example of determine total volume of runoff • Step 1: We can determine the volume by creating a bar graph to estimate volume as shown in the next figure: • Step 2 = Sum the bar graphs So total volume = 9100 cfs-hr = 9027.78 ac-in (1.008 cfs-hr = 1 ac-in)
Finding the volume left to infiltration • Depending on the soil types, runoff will not begin until the soil is completely saturated. • There is a way to find how much water was infiltrated into the soil during a rain event. • If given an amount of rainfall and the amount of direct runoff. Infiltration is equal to the difference between rainfall and direct runoff (evaporation is ignored) • This is summarized in the next example.
Example of finding the volume left to infiltration. • Given our previous 2600-acre basin with a runoff of 9100 cfs-hr. Determine the amount of volume left to infiltration knowing that there was 4.0 in. of rainfall.
Example of finding the volume left to infiltration. • Step 1: Convert cfs-hr to ac-in • 9100 cfs = 9027.78 ac-in • Step 2 = Divide ac-in by acres • 9027.78 ac-in / 2600 ac = 3.47 = 3.5 inches- amount of direct runoff • Step 3 = Subtract direct runoff from rainfall • 4.0 – 3.5 = 0.5 in was left to infiltration.
Unit Hydrographs • Unit Hydrograph: The unit hydrograph represents the basin response to 1 inch (1 cm) of uniform net rainfall for a specified duration. • Works best for relatively small subareas (1-10 sq miles) • Assumptions • Rainfall excesses of equal duration are assumed to produce hydrographs with equivalent time bases • Rainfall distribution is assumed to be the same for all storms of equal duration • Direct runoff ordinates for a storm of given duration are assumed directly proportional to rainfall excesses volumes • 2X the rainfall produces a doubling of hydrograph ordinates
Unit Hydrographs • In summary • The hydrologic system is linear and time invariant. • This means that complex storm hydrographs (the hydrographs we’ve looked at) can be produced by adding up individual unit hydrographs, adjusted for rainfall volumes and added and lagged in time. • This is known as hydrograph convolution (see next example)
Timing Parameters: UH • Lag time: (L or Tp) time from the center of mass of rainfall to the peak of the hydrograph • Time of Rise: (Tr) the time from the start of rainfall excess to the peak of the hydrograph • Time of Concentration: (Tc) the time from the end of the net rainfall to the inflection point of the hydrograph • Time Base: (Tb) the total duration of the DRO hydrograph
Developing a Storm Hydrograph from a 1 hr Unit Hydrograph-Unit Hydrograph Convolution • To find the storm hydrograph from the unit hydrograph it is necessary to have the rainfall ordinates for that given storm. • The flow (U) ordinates of the Unit Hydrograph are also needed. • Then, the (U) will be multiplied by P1 then by P2 until it has been multiplied by all the rainfall ordinates. • Everytime you move to a different rainfall ordinate, you lag by one hour (since we have a 1-hr UH). • Once everything has been multiplied and lagged. For each hour, the resulting P*U for that hour are added. This gives the flow of the storm (Q) for that hour. • These steps are shown in the next example
Unit Hydrograph Convolution • Deriving hydrographs from multiperiod rainfall excess or • Where • Qn = storm hydrograph ordinate • Pi = rainfall excess • Uj = UH ordinate • where j = n - i + 1
Storm Hydrograph from the Unit Hydrograph • Given the rainfall excess and the 1-hr UH derive the storm hydrograph for the watershed using hydrograph convolution. Compute the resulting hydrograph and assume no losses. P = [0.5, 1.0, 1.5, 0, 0.5] in. U = [0,100, 320, 450, 370, 250, 160, 90, 40, 0] cfs From Bedient et al. Hydrology and floodplain analysis. 4th Ed. Example 2-5
Storm Hydrograph from the Unit Hydrograph P = [0.5, 1.0, 1.5, 0.0, 0.5] in. U = [0,100, 320, 450, 370, 250, 160, 90, 40, 0] cfs Step 1 • Want to multiply U by each P and lag by one hour everytime you move to the next P. • Then for each hour you add your results for that following time, that will give you Q.
Storm Hydrograph from the Unit Hydrograph P = [0.5, 1.0, 1.5, 0.0, 0.5] in. U = [0,100, 320, 450, 370, 250, 160, 90, 40, 0] cfs Step 2 • Want to multiply U by each P and lag by one hour everytime you move to the next P. • Then for each hour you add your results for that following time, that will give you Q.
Storm Hydrograph from the Unit Hydrograph P = [0.5, 1.0, 1.5, 0.0, 0.5] in. U = [0,100, 320, 450, 370, 250, 160, 90, 40, 0] cfs Step 3 • Want to multiply U by each P and lag by one hour everytime you move to the next P. • Then for each hour you add your results for that following time, that will give you Q.
UH Convolution Example • Pn= [0.5, 1.0, 1.5, 0.0, 0.5] in • Un= [0, 100, 320, 450, 370, 250, 160, 90, 40, 0] cfs
Uniform Open-Channel Flow • Uniform open channel flow is the hydraulic condition in which the water depth and the channel cross section do not change over some reach of the channel. • The total energy change over the channel reach is exactly equal to the energy losses of boundary friction and turbulence. • Strict uniform flow is rare in natural streams because of the constantly changing channel conditions. • Often assumed in natural streams for engineering calculations. • To calculate flow within a channel equations such as the Chezy eq. and Manning’s equation are used.
A Manning’s Equation Q = Flowrate, cfs n = Manning’s Roughness Coefficient (ranges from 0.015 - 0.15) S = Slope of channel in longitudinal direction R = A/P, the hydraulic radius, where: A = Cross-sectional Area of Flow (area of trapezoid or flow area) P = Wetted Perimeter (perimeter in contact with water) A A P = Wetted Perimeter Pipe P = Circum. Natural Channel Note: this equation is for U.S Customary units-for the metric units 1.49 is 1
Example of calculating flow • Brays Bayou can be represented as a single trapezoidal channel with a bottom width b of 75 ft and a side slope of 4:1 (horizontal:vertical) on average. If the normal bankfull depth is 25 ft at the Main St. bridge, compute the normal flow rate in cfs for this section. Assume that n = 0.020 and S = .0002 for the concrete-lined channel. From Bedient et al. Hydrology and Floodplain analysis 4th Ed. Example 7-3
Example of calculating flow • Given y = 25 ft n = 0.02 S = 0.002 b = 75 ft • Manning’s Equation is used to compute Q and from the geometry provided: = • A = = 4375 ft^2 P = = 281.16 ft • Then all the values are plugged in to give Q = 28,730 cfs