Download
1 / 8
80 likes | 200 Views
T-BEST Nothing But the BEST for Transit Planning and Ridership Forecasting. TBAG, October 28, 2004. Research Project Team. Ram M. Pendyala Dept of Civil & Environmental Engineering, Univ of South Florida, Tampa Steve Polzin and Xuehao Chu

E N D
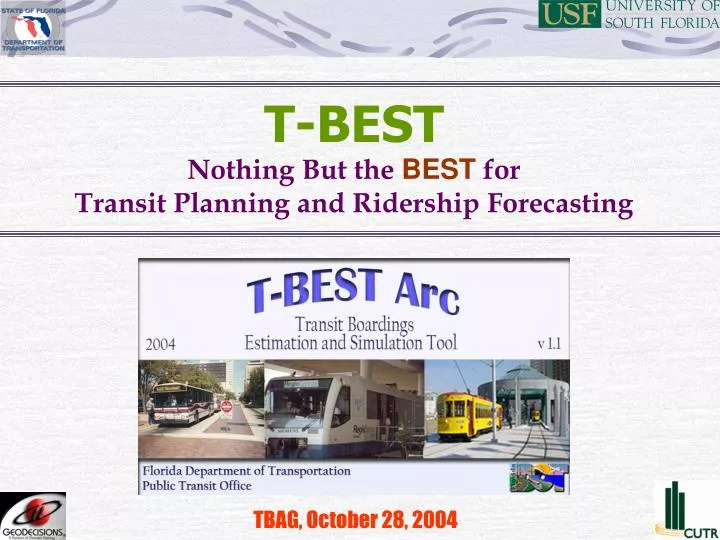
T-BESTNothing But the BESTforTransit Planning and Ridership Forecasting TBAG, October 28, 2004
Research Project Team • Ram M. Pendyala Dept of Civil & Environmental Engineering, Univ of South Florida, Tampa • Steve Polzin and Xuehao Chu Center for Urban Trans Research (CUTR), Univ of South Florida, Tampa • Software Development: Rodney Bunner Geodecisions, Inc., Tampa • Wade White* and Seongsoon Yun* Gannett Fleming, Inc. • Fadi Nassar Keith & Schnars PA, Fort Lauderdale • Project Manager: Ike Ubaka Public Transit Office, Florida Dept of Transportation, Tallahassee
History of Transit Model Development • FDOT Public Transit Office very proactive in transit planning tool development • TLOS and FTIS examples of transit planning and information tools • Transit ridership modeling tools • ITSUP: Integrated Transit Demand & Supply Model • RTFAST: Regional Transit Feasibility Analysis & Simulation Tool • Towards stop-level ridership forecasting models
T-BEST Arc 1.1 • Model estimates number of boardings at a stop by: • Route • Direction • Time period • Model estimates two types of boardings: • Direct Boardings: Walk and Bike Access • Transfer Boardings: Transit Access • ESRI ArcGIS based transit network mapping and coding capability
T-BEST Arc: A Sophisticated Planning Tool • T-BEST Arc accounts for: • Population and employment at stop • Accessible population and employment from stop • Route attributes • Fare Route type • Frequency Technology • Span of service Special generators • Transfers Time of day • Wait time, transfer time • In-vehicle time
Role of Accessibility and Connectivity • Transit ridership strongly affected by: • Destination accessibility • Temporal availability • Network connectivity • Competing and complementary stops • T-BEST sensitive to all four aspects of transit accessibility • Ability to test effects of alternative route and network design configurations on transit boardings • Sophisticated methodology in T-BEST
Model and Software Functionality • T-BEST provides user-friendly interfaces and functionality: • GIS interface for database setup and displays • Sets of default equations by time period • Automated buffering • Automated accessibility and impedance computations • Report generation including performance measures
T-BEST Arc Software • T-BEST 1.1 software development complete • Model estimation using APC data from Jacksonville • Statewide Census 2000 data included • Full GIS functionality for drawing/coding transit routes • Complete users guide available • Training @ USF Engineering Computer Lab on Wednesday, December 8, 2004 – Stay Tuned!