Download
1 / 26
260 likes | 390 Views
z∼7 Galaxies in the HUDF: First Epoch WFC3/IR Results. P.A. Oesch, R.J. Bouwens, G.D. Illingworth, C.M. Carollo, M. Franx, I. Labbé, D. Magee, M. Stiavelli, M. Trenti, and P.G. van Dokkum. ApJ, January 20, 2010 Presented by Sean Marshall AST 494. Terminology. z: redshift

E N D
z∼7 Galaxies in the HUDF: First Epoch WFC3/IR Results P.A. Oesch, R.J. Bouwens, G.D. Illingworth, C.M. Carollo, M. Franx, I. Labbé, D. Magee, M. Stiavelli, M. Trenti, and P.G. van Dokkum ApJ, January 20, 2010 Presented by Sean Marshall AST 494
Terminology z: redshift HUDF: Hubble Ultra Deep Field http://antwrp.gsfc.nasa.gov/apod/ap091209.html
Terminology http://www.stsci.edu/hst/wfc3/design/at_a_glance/ WFC3: Wide Field Camera 3
Introduction • Detailed studies of galaxies up to z ~ 6 • Use Lyman break galaxies (LBG) • Appear very faint (if at all) in UV filter • Lyman limit being redshifted past that filter • Indicate z > 2.5 http://www.astro.ku.dk/~jfynbo/LBG.html
Introduction • Less study of galaxies of z ~ 7 • About 13 billion years ago • Luminosity function – number per luminosity interval • Not well known for those galaxies • Would provide information on epoch of reionization http://xxx.lanl.gov/abs/1001.4538 and http://www.astro.ucla.edu/~wright/CosmoCalc.html
Introduction • Light bluer than Lyman limit is absorbed • For the most part • Lyman limit redshifted into near infrared (NIR) for z ~ 7 • NIR hard to observe well • But now we have WFC3! Figure 3
Observations • WFC3/IR observations in three filters • H160 (F160W), J125 (F125W), and Y105 (F105W) http://www.stsci.edu/hst/wfc3/design/at_a_glance/
Observations • 62 orbits during August and September of 2009 • See to magnitudes of 28.6-28.7 (AB) • 4.7 arcmin2 • This data set “allows us to generate the deepest NIR images ever seen”
Source Selection • Lyman Break technique – based on colors (differences between magnitudes) Figure 1
Source Selection • (z850 − Y105) > 0.8 • (z850 − Y105) > 0.9 + 0.75(Y105 − J125) • (z850 − Y105) > −1.1 + 4(Y105 − J125) • S/N(J125) > 5 ∧ S/N(Y105) > 5 • S/N(V606) < 2 ∧ S/N(i775) < 2 Figure 1
Source Selection • Selected galaxies have redshifts of 6.4 to 7.3; median of 6.8 • 16 candidates with 26.0 ≤ J125 ≤ 29.0 • Bluer than expected • Mostly metal-poor stars, little dust extinction • Or different initial mass functions (more massive stars than expected) • Possibly more ionizing radiation in these galaxies than expected
Sources Figure 2. All z ∼ 7 galaxy candidates in B435, V606, i775, z850, Y105, J125, and H160 (from left to right), ranked by their J125-flux. The sizes of the images are 2.2” × 2.2”.
Contamination? • Detections all > ~5σ • J125 band doesn’t pick up dwarf stars • Simulated contamination indicates that it is unlikely that there are any false positives which are actually “nearby” (z ~ 1.5) galaxies • One possible supernova (excluded from further analysis)
Luminosity Function for z ~ 7 • General form (from Schechter 1976): • Φ(L) dL = φ* (L/L*)α exp(-L/L*) dL/L* • An approximation that fits the data • More common to work in magnitudes • Φ(M) dM = 0.4 φ* ln(10) [100.4(M*-M)]α+1 exp[-100.4(M*-M)] dM • Set φ* = 0.0014 Mpc-3 mag-1 • φ* doesn’t really vary with z • From Bouwens et al. 2007 http://www.ucolick.org/~simard/phd/root/node7.html http://rocinante.colorado.edu/~pja/astr3830/lecture12.pdf
Luminosity Function for z ~ 7 • M* = -19.91 ± 0.09 • α = -1.77 ± 0.20 Figure 4
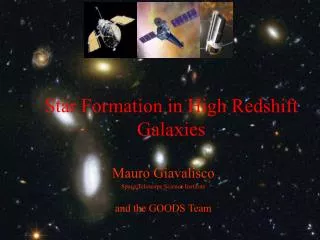
Structure and Morphologies of z∼7-8 Galaxies from HUDF P.A. Oesch, R.J. Bouwens, C.M. Carollo, G.D. Illingworth, M. Trenti, M. Stiavelli, D. Magee, I. Labbé, and M. Franx ApJ, January 20, 2010 Presented by Sean Marshall AST 494
Introduction • Study of galaxies at z > 6.5 leads to better galaxy formation models • Most models focus on galaxies’ masses and luminosities; not so much sizes • Expect that galaxies of a given L were slightly smaller at earlier times • LBGs at z ~ 2-6 previously found to be quite compact • Often with multiple cores • From mergers? Or just clumps?
Introduction • Focusing on the sixteen z ~ 7 Lyman Break galaxies from before (Oesch et al. 2010) • Average size 0.7 ± 0.3 kpc • Universe was about 800 Myr old • Also using five z ~ 8 galaxies (from Bouwens et al. 2009a)
Morphologies • Surface brightness profiles • Generally symmetric and compact, except: • Brightest one (top left) has two distinct components • Fourth one is weird; possibly separate Figure 1
Size Evolution • Want to compare quantities to LBGs at z ~ 4-6 • Take measured half-light radius, robs1/2 • Correct for broadening due to point-spread function: r1/2 = [(robs1/2)2 – rPSF2]1/2
Size Evolution • Luminosity-size relation • Red triangles/squares: Main data points (WFC3/IR; z ~ 7 on left, z ~ 8 on right) • Dark gray dots: z ~ 5-6 (WFC3/IR) • Light gray dots: z ~ 4 (optical ACS) • Blue: z ~ 7-8 L bin averages • Little change for z ~ 4-8 Figure 2
Size Evolution • Histogram of size comparison for one L bin at different redshifts • Yellow: z ~ 7 • Red: z ~ 6 • Green: z ~ 5 • Black: z ~ 4 • Changes in: • Tail (noticeable) • Peak (negligible) • Trend after z ~ 6 suggests galaxies are initially Figure 2
Size Evolution • Trend after z ~ 6 suggests: • Galaxies are initially formed as “small clumps” (0.4-0.8 kpc), regardless of luminosity • Later, accretion of cold gas leads to tail of large galaxies • But relatively few; peak doesn’t change very much Figure 2
Size Evolution • Average galaxy size as a function of time • For two luminosity bins • General form: r1/2 ~ (1 + z)-m • m = 1.12 ± 0.07 for brighter bin • m = 1.32 ± 0.52 for dimmer bin Figure 3
Star Formation • Seems to be concentrated in the centers of these galaxies • Average surface density of star formation: • Estimated at 1-10 MO/yr • Seems constant over about 7 > z > 3 • Indicates that star formation efficiency is fairly constant between galaxies, with only minor feedback effects • Except for starbursts in quasars
Conclusions • NIR capabilities vastly improved • Lots of information from just 16 data points! • Luminosity function indicates slow luminosity evolution • Low-L galaxies may have been dominant factor for reionization • Slow size evolution • Early star formation efficiencies fairly constant • Larger sample would be helpful