Download

1 / 41
420 likes | 701 Views
Analisis spektra UV-Vis senyawa kompleks. Warna senyawa kompleks. Penataan elektron yang sesuai. Konfigurasi elektronik atom multi-elektron. Apakah makna konfigurasi 2 p 2 ?. n = 2 ; l = 1; m l = -1, 0, +1; m s = ± 1/2. microstates

E N D
Penataan elektron yang sesuai Konfigurasi elektronik atom multi-elektron Apakah makna konfigurasi 2p2 ? n = 2; l = 1; ml = -1, 0, +1; ms = ± 1/2 microstates beda energi karena tolakan antar elektron (inter-electronic repulsions)
Konfigurasi elektronik atom multi-elektron pasangan RS Russell-Saunders (or LS) coupling Untuk tiap atom multi-elektron L = total orbital angular momentum quantum number S = total spin angular momentum quantum number Spin multiplicity = 2S+1 ML = ∑ml (-L,…0,…+L) MS = ∑ms (S, S-1, …,0,…-S) Untuk tiap elektron 2p n = 2; l = 1 ml = -1, 0, +1 ms = ± 1/2 • ML/MS menyatakan microstates • L/S menyatakan states (kumpulan microstates) • Group microstates dengan energi yang sama disebut terms
Menentukan harga L, ML, S, Ms untuk terms yang berbeda 1S 2P
Largest ML is +2, so L = 2 (a D term) and MS = 0 for ML = +2, 2S +1 = 1 (S = 0) 1D Next largest ML is +1, so L = 1 (a P term) and MS = 0, ±1 for ML = +1, 2S +1 = 3 3P One remaining microstate ML is 0, L = 0 (an S term) and MS = 0 for ML = 0, 2S +1 = 1 1S Mengklasifikasikan microstates p2 Spin multiplicity = # columns of microstates
Next largest ML is +1, so L = 1 (a P term) and MS = 0, ±1 for ML = +1, 2S +1 = 3 3P Largest ML is +2, so L = 2 (a D term) and MS = 0 for ML = +2, 2S +1 = 1 (S = 0) 1D ML is 0, L = 0 2S +1 = 1 1S
Energy of terms (Hund’s rules) Lowest energy (ground term) Highest spin multiplicity 3P term for p2 case 3P has S = 1, L = 1 If two states have the same maximum spin multiplicity Ground term is that of highest L
ML & MS Microstate Table States (S, P, D) Spin multiplicity Terms 3P, 1D, 1S Ground state term 3P before we did: p2 the largest ML L spin multiplicity = Σcolumns or 2S+1, S the largest MS
d2 3F, 3P, 1G, 1D, 1S For metal complexes we need to consider d1-d10 For 3 or more electrons, this is a long tedious process But luckily this has been tabulated before…
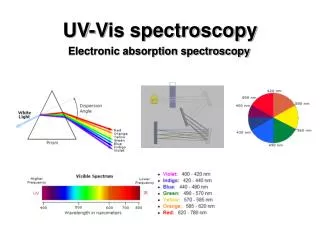
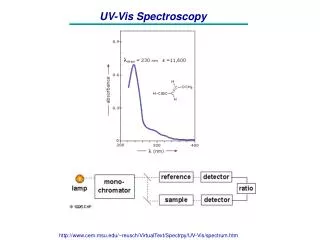
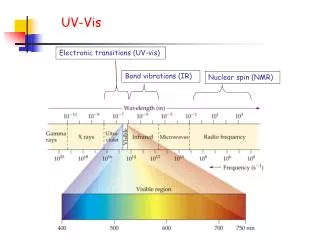
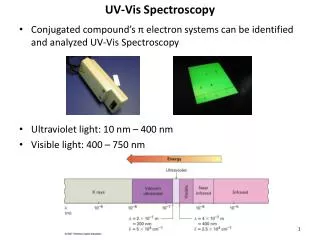
Transitions between electronic terms will give rise to spectra
Remember what we’re after ? Theory to explain electronic excitations/transitions observed for metal complexes
Selection rules (determine intensities) Laporte rule g g forbidden (that is, d-d forbidden) but g u allowed (that is, d-p allowed) Spin rule Transitions between states of different multiplicities forbidden Transitions between states of same multiplicities allowed These rules are relaxed by molecular vibrations, and spin-orbit coupling
3F, 3P, 1G, 1D, 1S Real complexes Free ion term for d2
Tanabe-Sugano diagrams • show correlation of spectroscopic transitions observed for ideal Oh complexes with electronic states • energy axes are parameterized in terms of Δo and the Racah parameter (B) which measures repulsion between terms of the same multiplicity d2
d2 complex: Electronic transitions and spectra only 2 of 3 predicted transitions observed
d3 d9 d1 d2 d8 TS diagrams Other dn configurations
d3 Other configurations The limit between high spin and low spin
The d5 case All possible transitions forbidden Very weak signals, faint color
Charge transfer spectra Metal character LMCT Ligand character Ligand character MLCT Metal character Much more intense bands
Determining Do from spectra d1 d9 One transition allowed of energy Do
mixing mixing Determining Do from spectra Lowest energy transition = Do
Ground state mixing E (T1gA2g) - E (T1gT2g) = Do