Download
1 / 18
180 likes | 349 Views
Enhanced Visual Analysis for Cluster Tendency Assessment and Data Partitioning. Liang Wang, Xin Geng, James Bezdek , Christopher Leckie, and Kotagiri Ramamohanarao Presented by Wen-Chung Liao 2010/12/08. Outlines. VAT Motivation Objectives Methodology SpecVAT A-SpecVAT P-SpecVAT

E N D
Enhanced Visual Analysis for Cluster Tendency Assessment and Data Partitioning Liang Wang, Xin Geng, James Bezdek, Christopher Leckie, and Kotagiri Ramamohanarao Presented by Wen-Chung Liao 2010/12/08
Outlines • VAT • Motivation • Objectives • Methodology • SpecVAT • A-SpecVAT • P-SpecVAT • E-SpecVAT • Experimental results • Conclusions • Comments
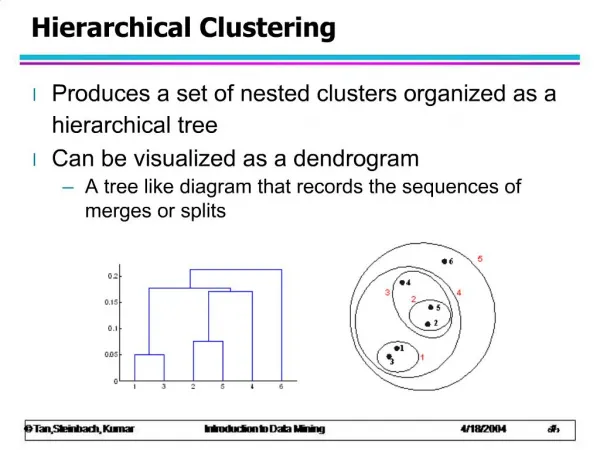
VAT: • Find P so that is as close to a block diagonal form as possible. • Only D is required as the input. • Matrix reordering produces neither a partition nor a hierarchy of clusters. D VAT (Visual Assessment of cluster Tendency) I(D) (Reorder the rows and columns of D)
Motivation • Reordered dissimilarity images (RDIs) • only effective in compact well-separated clusters. • However, many practical applications involve data sets with highly complex structure.
VAT SpecVAT Objectives • Propose a new approach to generating RDIs that combines VAT with spectral analysis of pairwise data. • Spectral VAT (SpecVAT) • images can clearly show the number of clusters c and the approximate sizes of each cluster for data sets with highly irregular cluster structures. • the cluster structure in the data can be reliably estimated by visual inspection. • A-SpecVAT: automated determination of the number of clusters c. • P-SpecVAT: partition the data into c groups. • E-SpecVAT: handle large data sets, in a “sampling plus extension” manner.
SPECTRAL VAT VAT D SpecVAT Spectral Mapping VAT SpectralMapping
SPECTRAL VAT O(Kn2) O( n3)
AUTOMATIC CLUSTER TENDENCY ASSESSMENT Find a “best” SpecVAT image in terms of “clarity” and “block structure.”
AUTOMATIC CLUSTER TENDENCY ASSESSMENT C1: diagonal dark block, “within-cluster blocks”, [1, ..., T] C2: non-dark block, “between-cluster blocks ”, [T+1, ..., L] • Measures for evaluating the class separability(clarity) C1 C2 σ2W:the within-class variance σ2B:the between-class variance σ2T:the total variance of levels • ξis the simplest measure to obtain an optimal threshold T* T • A-SpecVAT • Select the best SpecVAT image & determine the number of clusters as
VISUAL DATA PARTITIONING A c-partition matrix for O (a data set) A good candidate partition U? the contrast differences between the dark blocks along the main diagonal and the pixels adjacent to them. U={n1 : n2 : : nc} n1+n2 + +nc=n
(by GA) VISUAL DATA PARTITIONING Let U be a candidate partition Ew: mean dissimilarity within dark regions Ew Eb Eb: mean dissimilarity between dark and nondark regions P-SpecVAT
DEALING WITH LARGE DATA SETS ( A-SpecVAT Determine the number of clusters c O(Kn2) O(n3) SpecVAT E-SpecVAT Sampling m (<<n) rows from D O(m3) P-SpecVAT Out-of-sample extension (kNN) VAT
S-8 R-2
high-resolution image segmentation • infeasible to use the full data • five 481 321 images • 154,401 pixels • 300 samples • n=3,000,000 2D data points • a mixture of 5 normal distributions
Conclusions • The VAT algorithm has been improved by using spectral analysis of the proximity matrix of the data. • How to find a direct visual validation method will be one of important issues in our future work.
Comments • Advantages • Provide well mathematical analysis. (a good learning example) • Shortages • … • Applications • Clustering • Image segmentation