Download
1 / 15
160 likes | 363 Views
Disease Dynamics in a Dynamic Social Network. Claire Christensen 1 , István Albert 3 , Bryan Grenfell 2 , and R éka Albert 1,2 1 Department of Physics and 2 Center for Infectious Disease Dynamics, 3 The Huck Institutes for the Life Sciences

E N D
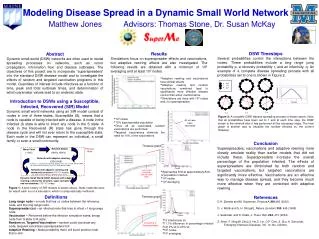
Disease Dynamics in a Dynamic Social Network Claire Christensen1, István Albert3, Bryan Grenfell2, and Réka Albert1,2 1Department of Physics and 2Center for Infectious Disease Dynamics, 3The Huck Institutes for the Life Sciences The Pennsylvania State University, University Park, PA 16802, USA
Social Structure and Disease Dynamics What is it about the demographics and connectivity of an underlying contact network that creates the most prominent features of the landscape in which a disease travels? • Below threshold: • chaotic epidemics • intervening fadeouts • Above threshold: • regular epidemics • few fadeouts The Classic Example: Population Size Grenfell, B.T., et. al, Ecological Monographs 72 (2002): 185-202 How do changes to that landscape affect the dynamic behavior of the disease?
Contact-transmission parameter Recovery rate Classical Mathematical Modeling of Disease Dynamics Basic model assumes full-mixing ofsusceptibles (S),infecteds (I),recovereds (R),such that rate of change of each group can be described by system of coupled differential equations: Model works well in large populations. Variants of model account for some features of small populations, but not all.
In-silico Simulation of Contact Networks and Disease Propagation: an Overview Why: -Probe link between (changing) topology of contact network and disease dynamics; -Incorporate statistical (social) data; -Small size not a problem How (first steps): -Simulate social network (families+workplaces+schools+individuals); -Statistical growth and change; -Disease propagates (WAIFW) along edges of network
**All statistics adapted from: 1)Vital Statistic of New York State (1990-2002), in ‘Information for a Healthy New York’, Health, N.Y.S.D. o,Ed. 2)‘U.S. Department of Labor Bureau of Labor Statistics’’ 3) Scardamalia, R., The Face of New York– the Numbers (2001) Dominant Social Processes/Features(For more information, please visit the poster exhibit) • Family Graphs: • ~54% adults married; • Fully-connected; • Average size is 3-4 • School Graphs: • Ages 6-18; • Classes fully-connected; max. size=40; • “Elementary” kids randomly interconnected to other classes with between .25 and .5 times class size interlinks (.25; .75 for High School); • Term forcing scheme • Basic Demographics/Social Processes: • Age distribution; • Fertility distribution; • Death rate; • Population growth; • Immigration • Work Graphs: • Ages 18-65; • 8% unemployment; • Number=1% net. size; • Hub-and-spoke; random attachment to min. 3 others thereafter
Susceptible: Age=6 Infected: Age=5 Dominant Disease Processes/Features(For more information, please visit the poster exhibit) • Immunity and Infection • Initial immunity-by-age profile; • Newborns lose maternally-acquired immunity; • Disease spreads from infected to susceptible via edges, and with rates from WAIFW matrix • Maintaining Epidemics • Sometimes necessary to “spark” population (S →I randomly); • Sparking function of form: • Pspark(t) ~ln(N(t)), where N(t) is total population size ** All statistics adapted from: Edmunds, W.J. et al., Epidemiology and Infection125 (2000): 635-650; Scardamalia, R., 'The Face of New York-- The Numbers' (2001); Grenfell, B.T. and Anderson, R.M., Proceedings of the Royal Society of London. Series B, Biological Sciences 236 (1989): 213-252.
Prevaccine Measles Comparison of infection profiles, interepidemic periods, and epidemic lengths Grenfell, B.T., et. al, Ecological Monographs 72 (2002): 185-202
Force of Infection Basic Reproduction Number (R0), Force of Infection, and the Influence of Contact Network Topology and Dynamics Past explanation: Topology of schools– contact network of most influential age cohort– is essentially the same, regardless of population size. However...
School Network Topology is NOT Independent of Population Size Why? Class interlinking and abundance of full classes differ with population size. Pop= 105 Pop=104 Different dynamic processes; same global characteristics!
Summary • In-silico simulation of contact networks and disease propagation has benefits of: A) Greater realism; B) Overcoming size/connectivity barriers; C) Window into interrelationship between (changing) network topology and disease dynamics at multiple scales of complexity and time • Using measles as a test bed, we have: 1) Captured dominant features of observed measles dynamics in large and small populations; 2) Provided some insight into epidemiological trends by clearly synthesizing topological and disease dynamic features. • We will extend the algorithm to other, less well-studied diseases and/or well-studied diseases in novel social environments.
Thank You Thank you to: Dr. Réka Albert Dr. Bryan Grenfell Dr. István Albert Dr. Anshuman Gupta Dr. Jeff Nucciarone NIH MIDAS Cluster (Dr. Ganapathi Laxminarayana) The organizers and sponsors of NetSci 2007
Total Degree Distributions Cumulative degree distribution for populations of size 105 (blue) and 104 (pink).
Seasonal Network Dynamics and Disease Dynamics Recent work suggests: Early-peaking epidemic at yeart Seasonally-curtailed epidemic at yeart+n No epidemic at yeart+n Stone, L. et al., Nature446 (2007): 532-536 Evidence of this in our networks, as well.