Wireless Sensor Network Dynamics: Connectivity, Asymmetry, and Protocol Design
Explore the effects of density, scale, and connectivity in wireless sensor networks through detailed experiments and algorithms. Investigate the impact of asymmetry on protocol design and tree-based routing.

Wireless Sensor Network Dynamics: Connectivity, Asymmetry, and Protocol Design
E N D
Presentation Transcript
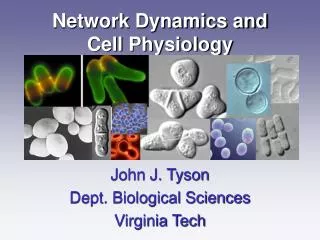
Network Dynamics Deepak Ganesan, Alec Woo, Bhaskar Krishnamachari
Motivation • Why do sensor network algorithms not behave as expected? • Distinguish the effect of density, scale and wireless connectivity • Example Algorithms • Flooding based algorithms • are intuitively appealing because of their robustness • Beacon-based Routing: Flood the network and construct a tree using the reverse flooded path. Use this path to draw data from sensor nodes to base station • Diffusion Routing: Flooding is the basic approach to setting up source-sink paths. Good reverse shortest paths are reinforced and data is sent along them • Localization Algorithms based on Radio Signal Strength • make assumptions about the basic shape of connectivity cell (usually circular) • The algorithm then computes target location from the intersection of multiple cells.
Deviations from Expected • There are two distinct effects that influence algorithms for wireless sensor networks • Vagaries in connectivity (local effects) • Mechanics of Flooding (global effects) • We dig deeper, by a set of carefully instrumented, large scale experiments, representative of the key characteristics of sensor networks • Experiment 1: Connectivity Matrix • Experiment 2: Broadcast Flooding
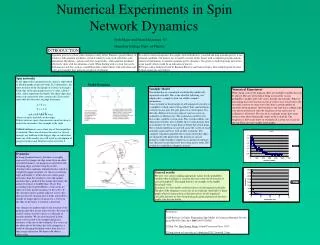
Understanding Connectivity • Motivation: • Construct a complete 2D map of packet loss between all pairs of nodes for a wide range of transmit power settings. This map can be used to drive dense sensor network simulations • Look for deviations from normal behavior, that could impact protocol design. • Experimental Setup • 13x13 grid of nodes • separation 2ft • flat open surface • Identical length antennas, pointing vertically upwards. • Fresh batteries on all nodes • Identical orientation of all nodes • The region was clean of external noise sources. • Experiment Details • Each node transmits at a range of 16 small increments of potentiometer settings (translating to different transmit power). • For each transmit power setting, each node transmits 20 packets. • Receivers log the packets that they have successfully received. • Nodes transmitted one after the other in a token-ring fashion, thereby preventing collisions.
The connectivity radius of node n is measured as the radius of the circle that encompasses 75% of the nodes that have a “good” link from node n. Defining “Good Link”: A link that has more than threshold T of successful packet reception. Connectivity Radius
Link Symmetry in Wireless Networks • The existence of asymmetric wireless links is known. Link asymmetry could be caused by many factors: • Presence of obstacles that do not symmetrically attenuate signals • Asymmetric multipath effects • Antenna directionality and orientation • No comprehensive large scale studies of the extent of link asymmetries. • We empirically evaluate extent of asymmetry and look at its impact on protocol design
Frequency B -> A A -> B Defining thresholds for asymmetric and symmetric links • One possible definition is • Asymmetric Link: Greater than 65% successful reception in one direction and less than 25% successful reception in the other direction • Symmetric Link: Greater than 65% successful reception in both directions
Importance of Asymmetric Links • Between 10%-25% asymmetric nature of links observed depending on transmit signal strength of nodes. • Many asymmetric links are long links, in fact, the number of asymmetric long links is comparable to the number of symmetric long links • Why are long links useful? • Beacon-based Routing: Long links can be used to build low-depth routing trees • Diffusion: short routing paths
Impact on Protocol Design • For topology construction protocols (beacon-based routing), the assumption of symmetric links may be dangerous. • In a tree, an asymmetric link disconnects a sub-tree from the root. • Option 1: Discard asymmetric links and use only symmetric ones • As shown earlier, long links that could be put to good use may be the ones discarded. • Option 2: Use asymmetric links • This requires rethinking and redesigning many existing algorithms • Either way, algorithms have to be designed to be robust to high unidirectionality.
Experiment 2: Broadcast Flooding • Motivation • Expected Behavior: Tree progresses outwards from the base station, acquiring more nodes along the way • Observed Behavior: • Some nodes seem to be attached at a completely different level to the tree from their peers • Some nodes have parents that are significantly farther off from the base station than themselves • The deviation from expected behavior is only partially explained by local behaviors (asymmetry, packet loss). The huge redundancy should mostly mitigate the local effects. • Experimental Setup • Same as Connectivity Experiment
Some observations from Broadcast Flooding Experiments • The parameters affecting the flooding were evaluated using four metrics • Extent of clustering • Impact of Collisions • Incidence of backward links • Extent of Symmetry • Correlation between distance from base-station and level of tree
Extent of Clustering • Most of the links belong to the large clusters • These observations are consistent with visualizations where a few nodes have very large number of children. • A large percentage of the nodes have very few children • Most clusters are small but a small number of large clusters exist.
Impact of Cluster Distribution • Command Broadcast Trees • High degree of clustering results in “bushy” trees. • Since most nodes are leaves, very few nodes retransmit command • Data Gathering Trees • Cluster-heads with many children use more energy listening and processing their children’s data.
Collisions have a significant effect • Propagating flood leaves stragglers due to hidden terminal effects. • As the tree propagates out to the edge of the network, it rebounds from the edge, picking up these stragglers. • This effect was seen in many experiments
Backward Links • Definition: A parent-child link is backward if the parent is farther away from the base-station than its child by at least 2ft. • Approximately 10% of links exhibit this behavior corresponding to 10% stragglers.
Symmetry • Definition: For the discovery experiment, a link between nodes a-b is symmetric if both a hears from b and b hears from b during tree formation. • Very high asymmetry observed (70%) as compared to the lower levels of asymmetry observed for the connectivity experiment • Reason: When two children that hear a packet (simultaneously) from a parent retransmit, the chances of hidden terminals happening are large. As a result, the parent node may miss many retransmissions.
Correlation between distance from base station and tree level • The cumulative effect of collisions on the constructed tree can be seen from the graph • Around 5% of far away nodes have a lower level than their peers (effect of long links) • Around 5-10% of close nodes have much higher level than their peers (stragglers) stragglers Effect of long links
Conclusion • Understanding local and global network effects, and the effect of their interaction • Investigating large-scale sensor network effects • Defining the experiments • data collection mechanisms • metrics