Download
1 / 1
10 likes | 145 Views
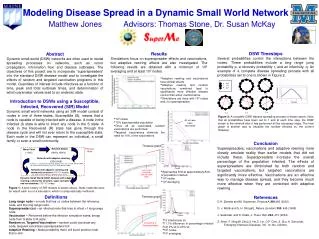
This project explores the dynamics of disease spread in dynamic small world (DSW) networks, incorporating the impact of superspreaders and vaccination strategies. Utilizing a Susceptible-Infected-Recovered (SIR) model, the research examines how adaptive rewiring interacts with random and targeted vaccination efforts to mitigate outbreaks. Key outcomes include analysis of infective trends over time, peak infection periods, and the effect of various parameter values on disease dynamics. The findings suggest that targeted vaccinations significantly enhance disease control compared to random vaccinations alone.

E N D
q=1 r=1 p=1 S I R T=1 T=0 T=4 T=2 T=3 Modeling Disease Spread in a Dynamic Small World Network Matthew Jones Advisors: Thomas Stone, Dr. Susan McKay DSW Timesteps Several probabilities control the interactions between the nodes. These probabilities include a long range jump probability p, a recovery probability r, and an infectivity, q. An example of a complete disease spreading process with all probabilities set to one is shown in Figure 2. Results Simulations focus on superspreader effects and vaccinations, but adaptive rewiring effects are also investigated. The following results are obtained with a minimum of 104 averaging and at least 105 nodes. Abstract Dynamic small world (DSW) networks are often used to model spreading processes on networks, such as rumor propagation, information flow, and disease outbreaks. The objectives of this project are to incorporate “superspreaders” into the standard DSW disease model and to investigate the effects of random and targeted vaccination programs in this model. Quantities of interest include infectives as a function of time, peak and total outbreak times, and determination of which parameter values lead to an endemic state. Introduction to DSWs using a Susceptible, Infected, Recovered (SIR) Model Dynamic small world networks using an SIR model consist of nodes in one of three states. Susceptible (S), means that a node is capable of being infected with a disease. A node in the Infected (I) state is able to infect any node in the S state. A node in the Recovered (R) state has gone through the disease cycle and will not ever return to the susceptible state. Each node in the DSW can represent an individual, a small family or even a small community. • Adaptive rewiring and vaccinations have similar effects. • Adaptive rewiring and random vaccinations combined lead to significantly more effective disease control than either method alone. • Simulations are done with 106 nodes and, no superspreaders. Figure 2: A complete DSW disease spreading process is shown above. Note that all probabilities have been set to 1 and at each time step, the DSW shown is the network after it has performed all the necessary steps. The final graph is another way to visualize the number infected vs. the current timestep. • 106 nodes • 10% superspreader population • Once all ss vaccinated, random vaccinations are performed • Targeted vaccinations eliminate the need for 10% of the vaccinations All ss have been vaccinated Conclusion Superspreaders, vaccinations and adaptive rewiring more closely emulate reality than earlier models that did not include these. Superspreaders increase the overall percentage of the population infected. The effects of superspreaders are diminished by both random and targeted vaccinations, but targeted vaccinations are significantly more effective. Vaccinations are an effective way to manage disease spread, and they become much more effective when they are combined with adaptive rewiring. References D.H. Zanette and M. Kuperman, Physica A 309,445 (2002). D. J. Watts and S. H. Strogatz, Nature (London) 393, 440 (1998). J. Saramaki, and K. Kaski, J. Theor. Biol. 234, 413 (2004). Z. Shen, F. Ning,W. Zhou,X. He,C. Lin, D.P. Chin, Z. Zhu, A. Schuchat, Emerging Infectious Diseases, Vol. 10, No. 2(2004). Timestep graph Network Based Previous Work Mean Field (~1920) (1980’s,1990’s) Network with adaptive rewiring (2006,2008) T. Gross, C.J. Dommar D’Lima and B. Blasius, Phys. Rev. Lett. 96, 208701 (2006) L.B. Shaw and I.B. Schwartz, Phys. Rev. E 77, 066101 (2008) Network with adaptive rewiring and community structure (103-104 nodes) T.E. Stone and S.R. McKay, submitted to Phys. Rev E. Increasing # infected by Superspreader nodes • Approaches limit at approximately 84% of population infected • 105 nodes • 104 averaging Dynamic Small World (DSW) Network with adaptive rewiring, community structure, super spreaders and vaccinations. (106-107 nodes) Figure 1: A brief history of SIR models is shown above. Static networks must be rebuilt each run of a simulation, which is computationally inefficient. Definitions Long range node – a node that has >z nodes between the reference node, and the long range node Superspreader (ss) – an infected node that tries to infect >1 long range node Vaccination – Performed before the infection simulation starts, brings node from S state to R state Random vs. Targeted Vaccination – random could vaccinate any node, targeted vaccinates superspreaders first Adaptive Rewiring – Node probability that it will avoid another node that is sick Timestep graph • 10 infected per ss • 11.1% difference in percentage infected from 0% ss to 20% ss • 105 nodes • 104 averaging Increasing % Superspreaders