Download
1 / 36
370 likes | 560 Views
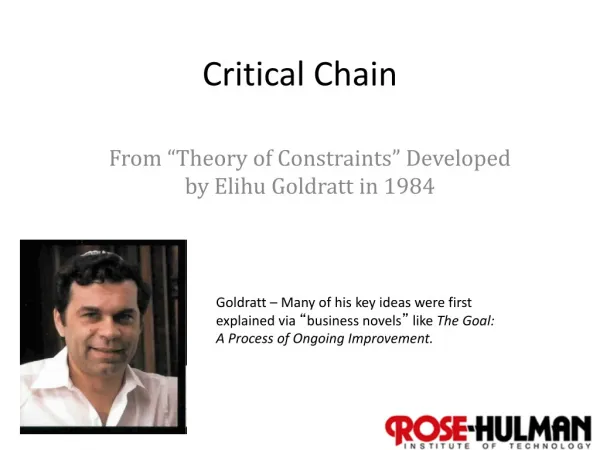
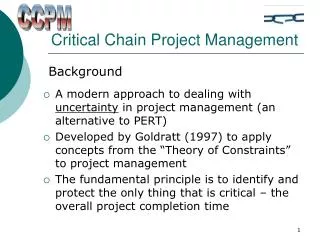
Critical Chain Method. Complex solutions do not work, the more complex the problem the simpler the solution must be. Eli Goldratt. These sides and note were prepared using 1. The book Streamlined: Building Lean Supply Chain Using the Theory of Constraints. Srinivasan . McGraw-Hell.

E N D
Critical Chain Method Complex solutions do not work, the more complex the problem the simpler the solution must be. Eli Goldratt. These sides and note were prepared using 1. The book Streamlined: Building Lean Supply Chain Using the Theory of Constraints. Srinivasan. McGraw-Hell. 2. The slides originally prepared by Professor M. M. Srinivasan. 3. Presentation of Dr. Daniel Walsh, Vector Strategies. Continuous Process Improvement Summit. 2012, Northridge, CA. 3. Presentation of Dr. Rob Richards, Stottler Henke. Continuous Process Improvement Summit. 2012, Northridge, CA.
Predicting the Future It is tough to make perdition, especially about the future. Yogi (Lawrence P.) Berra, Baseball catcher and manager, 1925. The best way to predict the future is to create it. Peter F. Druker. Writer and professor, 1909-2005.
Why Projects are Late • Unavailability of resources. • Not high enough priorities • Murphy Law • … • ….. • …. • They ran out of time
Wrong Metrics - Gedanken Courtesy of Dr. Daniel Walsh, Vector Strategies.
Project Management: Problems Usually Faced Task durations are highly variable. A lot of uncertainty involved in estimating task durations Project is not clearly defined : Known Work + Known Unknown Work + Unknown Work. Existing project work is not complete before new projects shift priorities leading to multi-tasking. Problems in a project cascade into another project. Constant pressure to increase staff for peak loads.
Task Duration • An activity is composed of three types of work: Known Work + Known Unknown Work + Unknown Work. • Due to unknowns, task durations are highly variable. People usually give a number that they expect to have a 10% chance or less of missing. There is 90% or more probability that the duration is less than the given number. Inflated task times reduce productivity and unnecessarily inflate budgets. • CCPM motivates people to give a number they have a high probability (50% or more) of missing. The idea is to pool task buffers and allow the tasks to use the buffer only if they need it.
Task Duration • The buffer for the critical chain is smaller than the sum of the buffers required for all the tasks on the critical chain. • Protecting task times with buffers will degrade on-time performance, • Providing specific due date to complete each specific task is against a systematic approach, and • Aggressive-but-possible task times increase on-time completion of the projects.
If each task has mean of 15 and StdDev of 5. With 95% probability each task is completed in 25 days. Project 50 days. But Variance of the critical path is 25+25=50, StsDevof = 7.1 We can have duration of 15 for each task and a 14.2 days project buffer. With 95% probability, the project is complete in 44.2 days. Sequential Tasks Task 1 Task 2 Task 1 Task 2 Buffer
Task Duration Syndromes • Parkinson’s syndrome : Work expands to fill the time available. People tend to continue working on a task that could have been completed earlier if they are given a pre-specified completion time. • Continue to Polish syndrome (aka: the 3-Minute Egg Rule): It’s not quality if it’s finished before time is up. • Student Syndrome: When people feel there is plenty of time to complete a task, other things become important and they procrastinate on the task.
Managing Projects Under Uncertainty Task 1 Task 3 Task 1 Task 5 Task 1 Task 3 Task 2 Task 2 Task 4 Task 2 5 25
Consider a simple project with 2 tasks performed by 2 different operators. Sequential Tasks Task 1 Task 2 5 25 Assume task durations are uniformly distributed (5,25). On average 15 days. Generate 1000 Projects What is average project completion time? 30 days StdDev < StdDev1 + StdDev2
Consider a slightly more complex project. Merging Nodes 5 25 Task 1 Task 3 Task 2 What is the average project completion time? 33 days Task 3 = Max(Task 1, Task2)
Merging Nodes Probability of completing project in 30 days? 33%
The affect of resource interdependencies on a simple project. Merging Nodes and Resources Task 1 Task 3 Task 5 Task 2 Task 4 5 25 What is the average project duration? What is the probability of competing the project in 45 days.
1000 Instances • A project’s most likely completion time is much larger than the sum of the averages of the tasks making up it’s longest path (due to synchronization or due to task dependencies). • So, how do we quote estimated completion time of the project? • Do people give a number that they know has a high (50% or more) chance of missing?
Task and Project Durations – the Traditional Way 5 25 Task 1 Task 3 Task 5 Task 2 Task 4 So, the average task times are “padded” to accommodate any possible delays. Instead of specifying a 50% time estimate (which fails half the time), a 98% confidence estimate is developed for the tasks and project duration. 98% of [5,25] = 5+.98*20 = 5+19.6 = 24.6 What is the chance the project will complete in 70 days?
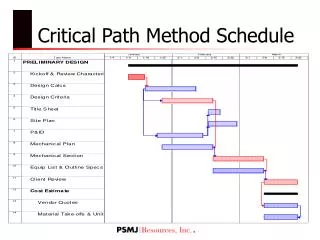
5 7 T3 T1 3 T5 S 8 4 T2 T4 Given CPM computation, the project will take 15 weeks, and all tasks are on the critical path. If the project was scheduled for 20 weeks, there is a 5 week project buffer.
Project Buffer and Feeding Buffers a) Compute the project buffer. b) Compute and identify the feeding buffer(s).
Fever Chart Courtesy of Dr. Daniel Walsh, Vector Strategies.
Fever Chart Courtesy of Dr. Daniel Walsh, Vector Strategies.
Buffer Management: Allocate Resources to Tasks Based on “Buffer Burn Rate” Chain 1 Buffer 20% buffer consumed 33% work completed Chain 2 Buffer 60% buffer consumed 50% work completed Burn Rate:% of buffer consumed vs. % of work completed. Automatically calculated on an ongoing basis to assess how much buffer is still available for future uncertainties. Task Priorities: Tasks that lie on chains with less safety remaining are given top priority. This ensures that buffers are not wasted, and also reduces pressure to multitask.
Pipelining: Release Projects Based on Constraints Instead of Starting ASAP Pipelining Most heavily loaded resource • Most heavily loaded shared resource (constraint), determines throughput • Project starts are based on constraint’s capacity, • Pressure to multitask also comes down Pipelining is more efficient than starting projects ASAP ãRealization Technologies, Inc.
Erroneous assumptions: Protecting task times with buffers will improve on-time performance (this is a biggie) By finishing too soon, people hurt their future negotiating power. Providing milestones for each task is good It is good to induct work as soon as possible Multitasking is beneficial What to Change?
Summary: Sources of Project Delays • Synchronization Delays • Integration (assembly) points • Resources and tasks • Delays due to Behavioral Effects • Parkinson’s Law • Student Syndrome • Continue to Polish Syndrome • Queuing Delays • Induct work ahead of schedule • Multitasking
50% chance od failure, not 1%. Avoid the 3 syndrome. Aggregation, project buffer, feeding buffers Integrate the resources into the CPM. Proactive, leading, how much of PB is consumed. Not how many days have you worked on the task, but how many days do you need to complete the task. Team work culture at the project level not individualism at task level Managing by exception, fever chart, what are todays priorities? Avoid multi-tasking, follow constraint recourse based release. Avoid inducting work ahead of schedule (ASAP). Do not switch the Critical Chain Summary