Download

1 / 70
740 likes | 966 Views
Critical Chain Project Management. BCS Nottingham & Derby Winter School 2006. Steven Wray, BA, MBA, MBCS, C Eng. Phone: 07951 727 490 e-mail: steve@wrayassociates.com web: www.wrayassociates.com. What makes a Project ?. One end-point At least two tasks, linked by dependency

E N D
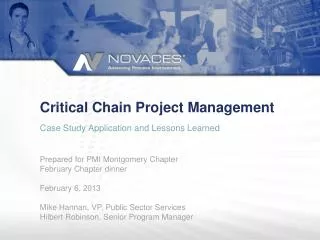
Critical Chain Project Management BCS Nottingham & Derby Winter School 2006
Steven Wray, BA, MBA, MBCS, C Eng Phone: 07951 727 490e-mail: steve@wrayassociates.comweb: www.wrayassociates.com
What makes a Project ? • One end-point • At least two tasks, linked by dependency • Significant inherent unpredictability in how long the tasks will take.
What do we want from Project Management ? • Reliable on time in full to budget delivery performance More revenue, more Profit, happy customers • A stable plan More Productive use of resources • Simple, objective measures of Project progress Shorter meetings, better informed stakeholders - less waste, more productivity • Simple, objective measures of Project health status Shorter meetings, better informed stakeholders - less waste, more productivity • Clear signals for when corrective action is - and is not - necessary Better directed recovery efforts - less waste, more productivity • Direction for ongoing improvement efforts The future brings more revenue, more profit, happier customers than the present
What is our normal experience from today's way of Project Management ?
What is our normal experience from today's way of Project Management ? • Reliable on time in full to budget delivery performance ? Or A continuous struggle with time, cost and scope ? • A stable plan OrRepeated rescheduling ? • Simple, objective measures of Project progress ? Or Clarity at the start and end, thick fog in between ? • Simple, objective measures of Project health status ? Or Subjective assessments compounded by human factors ? • Clear signals for when corrective action is - and is not - necessary ? Or Intervening too much too early, and too little too late ? • Direction for ongoing improvement efforts ? Or "We'll improve our methods when things get better"
'Normal' Practice in the planning phase • We identify the tasks in the Project and specify the resources needed for each one • We allocate to each task sufficient time that we are confident will allow it to be completed with those resources. That is, the time the task should take on average, plus some contingency to give us the confidence we seek • We apply task dependencies, and work out the longest path of tasks in the Project • The time along this path is the time-line of the Project
Normal practice in the execution phase • As long as every task completes on time (within its contingency), its successors will be started on time • As soon as any task finishes late (outside its contingency), its successors will start late, and this normally means they will finish late • In order to rescue a Project which shows any lateness, we have to squeeze the remaining tasks in the Project • Typically we have to compromise on time, cost or scope and reschedule
The Estimating Dilemma • If I allow more time for every task in the plan, each task is less likely to be late, but the Project end date will be later... • If I allow less time, the end date will be earlier, but the Project is more likely to overrun • BUT I have to deliver the Project on time
How long should we allow in the plan for a task ? • Some staff work more quickly than others • Sometimes staff are distracted or interrupted • Sometimes necessary resources are delayed • Some staff are risk-averse in their commitments • Some organisations reinforce risk-aversion
How long do we allow in the plan for a task ? The average time the task ought to take an average performer who focuses on it PLUS The time we expect to be spent on distractions PLUS A contingency time to take account of: • The spread between average and low performers • Our uncertainty in the average time • Our uncertainty in the time for distractions • How risk-averse we are or have to be
Some simple maths If we set our estimates so that we are 90% sure that any one task will be completed on time If we have 20 tasks in our Project The Probability that all the tasks will be on time is: 0.920 = 12% For 50 tasks, the Probability of all on time is: 0.950 = 1%
Emphasising • Doing things by the text-book, with 20 tasks, each of which we are 90% sure will complete on time, we have an 88% probability of being late for the Project • With 50 tasks, its a lot worse: its a 99% probability of being late for the Project
What if we change our estimating to a 95% confidence level ? • NB This will inflate the time for every task maybe by 25 - 50% because we will need more contingency • For 20 tasks the probability of being late is now 64% (was 88%) • For 50 tasks we are late now 92% (was 99%) We have very much extended our Project time-line, and increased our chances of success from 12% to 36% for the small Project, and from 1% to 8% for the large Project
Surely, there's a better way... • Plan A - invest our energy in reducing the extent of the variability: • Allowing longer in Project planning stage for preparing estimates • Training staff in estimating • Use of formal estimating methods • Measuring progress (CSC tools) and feeding results back into estimating practice • More detailed specifications • Less flexibility over changes to specifications • Training the staff better in their job content • Using individual performance measures to identify poor performers • Keeping projects short (c 6 months), breaking larger undertakings into several short Projects Doing this can help, but doesn't solve the problem
Plan B - Coping behaviours • Project Managers fight to be assigned the most viable Projects • Project Managers fight for the best staff • Project Managers fight to keep the Project scope down • Project Managers exploit changes in scope to unduly extend timelines and budgets • Project Managers sandbag Project plans to create headroom • Project Managers quit long Projects well before the delivery date • Project Managers disregard targets they know to be impossible • Staff work double shifts in the final weeks / months • Dumping the blame elsewhere Doing these may help the individual, but not the organisation
Plan C: Approach the problem in a different way We can reduce variability, but we cannot eliminate it, because it is inherent to the nature of a Project We must manage the variability that remains
How we handle variability in Critical Chain • We do not build in any contingency at the Task level • We move all the contingency to the Project level - we call this the Completion Buffer Individual Tasks can now be late without affecting the completion date of the Project The Project due date is protected as long as the accumulated lateness along any one chain is less than the completion buffer
What difference does this make to our probability of being late ? Under 'normal' practice, if any task is later than its contingency allows, we have a problem Under Critical Chain, we only have a problem if the total lateness exceeds the total contingency This second condition is much less likely than the first [ Law of averages / Central limit theorem] and increasingly so as the number of tasks increases
The Completion Buffer • A Buffer is a block of time which protects a deliverable from being affected by delays upstream. The Completion Buffer protects the Project completion date • Over the course of the Project we expect our buffers to be used up, in proportion to progress made
Scarcity of Resources • In putting together the plan, we must take into account scarcity of resources • In particular, if two tasks want exclusive use of the same resource, at the same time, they have to be staggered • This affects the plan in a similar way to the task dependencies
Scarcity of Resources Task C depends on both A and B Each task uses a different resource Task A – 10 d Task C – 10 d Task B – 10 d Project Time required - 20 d
Scarcity of Resources Task C depends on both A and B, Both A and B need exclusive use of the same resource Task A – 10 d Resource conflict Task C – 10 d Task B – 10 d Project Time required - 30 d
The Critical Chain • We identify the longest chain of dependent tasks by resource through the Project - this is the Critical Chain, at the end we place the Completion Buffer The time taken to complete the Project is the time taken to complete the Critical Chain Any delay in the Critical Chain delays the Project completion
Completion Buffer Task A Completion Buffer Task C Task B Committed end date
In Practice Task A Task C Task B Project duration held constant Task A Completion Buffer Task C Task B The buffer is 25-33% of chain length
Feeding Chains • All the other chains of tasks we call Feeding Chains , because each one at some point feeds into the Critical Chain • Every task in the Project is part of either the Critical Chain or a Feeding Chain
Feeding Buffers • We must not allow anything to delay the Critical Chain • We must protect the critical chain from being delayed by lateness in the Feeding Chains • We start the feeding chains a little early, and insert a block of time to decouple the Critical Chain from each Feeding Chain • We call these blocks of time Feeding Buffers
Feeding Buffers Task A Completion Buffer Task C Task B FB Task D
Planning Phase Summary • There is no contingency at task level • The Project due date is protected by the a block of time called the Completion Buffer • The Critical Chain is the longest chain of tasks through the Project • All other chains of tasks are Feeding Chains • We place Feeding Buffers to decouple the Critical Chain from the feeding chains
Execution phase.... • We have a great plan - what can happen in execution ?
Critical Chain in the Execution phase.... • No multi-tasking - when someone starts a task they stick to it until it's completed
Bad Multi-tasking Whenever I put down one task and pick up another, I lose productive time How much time is lost switching depends on how deep or shallow the task in hand is Putting a stop to multi-tasking in effect creates extra capacity
More Bad Multi-tasking If we have two people, each available 50% to our Project, and they have to work together, they are effectively 25% available If we have four such people, it's effectively 6%, so we'll wait on average 8 working days to get them together for half a day Real-life case: Ten team leaders, each on 50% availability: Out of two Project meetings held, 3 came to both, 5 to one or the other, 2 to neither
Very Bad Multi-tasking When someone stops doing a task on the Critical Chain, and starts doing something else, they are delaying the entire Project
Critical Chain in the Execution phase.... • No multi-tasking - when someone starts a task they stick to it until it's completed • We begin each task as soon as resource is available and prerequisite tasks are complete The timings in the plan are for planning, not a commitment on execution
Critical Chain in the Execution phase.... • No multi-tasking - when someone starts a task they stick to it until it's completed • We begin each task as soon as resource is available and prerequisite tasks are complete • We finish each task as soon as we can Early finishes on Critical Chain tasks bring forward the whole Project Early finishes on Feeding Chains increase the protection of the Critical Chain Sometimes we call these three together 'Roadrunner' style
Summarising Practical differences... • Planning phase: • The Project is analysed into the Critical Chain and Feeding Chains • Contingency is aggregated into a Completion Buffer protecting the Project end-date, and Feeding Buffers protecting the Critical Chain • Execution Phase • No Multi-tasking • Early finish / allowing early start of following tasks • Subordination to the Critical Chain
Measures and Management • How do we know how the Project is doing?
Measures and Management Making less progress than planned will eat into the Completion buffer Making more progress than planned will add to the Completion buffer A C B At day 5, task A has 8 days remaining (of 10) - Completion Buffer is eroded by 3 days Task D is completed - no effect on Completion Buffer D
Measures and Management • Question 1: How many days work until the Project is completed ? • Answer = the number of days left on the Critical Chain It is the time on the Critical Chain that determines the time required to complete the Project
Measures and Management • Question 2: How certain are we about the answer to Question 1 ? • Answer = the proportion of the Completion Buffer that we have left,compared to the proportion of the Critical Chain still to do The Completion Buffer protects the end date. The less (more) it is eroded, the less (more) the end date is at risk
Corrective Action We compare the percentage of the Completion Buffer Remaining (%CBR) with the percentage of the Critical Chain Remaining (%CCR) We set trigger points for corrective action, for example: • When the ratio %CBR / %CCR is 1or more, Project status is GREEN - Watch • When %CBR / %CCR is between 1 and 2/3, Project status is AMBER - Prepare a recovery plan • When %CBR / %CCR is less than 2/3, Project status is RED - Implement recovery plan
Measures in 2-D 0 % Completion Buffer Remaining 100 % Critical Chain Remaining 100 % 0 %
Don't overreact to buffer erosion • We expect our buffer to be used up over the course of the Project • Our date is not threatened if the buffer is used up in proportion to progress • If we have 2/3 of the completion buffer left and only 1/3 of the Project to do we are doing fine • Our date is threatened if the buffer is used up disproportionately • If we have 2/3 of the Project still to do but have only 1/3 of the completion buffer left we have a problem
Measures Summary • We have simple, objective measure of Project progress • We have a simple, objective measure of Project health status • We have a simple rule for triggering - and not triggering - corrective action We can redefine the Project progress meeting as the Buffer Management Meeting
Buffer Management Meeting Attendees: Project Manager,Project Sponsor / Owner, Task Managers, Resource Managers Agenda: • Reminder of what tasks are on the Critical Chain. • Review Project status ( % Critical Chain outstanding). • Review Completion buffer status (Red, Amber, Green). If necessary, initiate corrective actions. • Review Feeding buffers status (Red, Amber, Green). If necessary, initiate corrective actions. • Review tasks in progress to ensure earliest completion in full. • Review tasks not started to ensure earliest start where appropriate.
Using Buffer Management to drive ongoing improvement • Buffer Management measures are fact-based and objective • Buffer Management meetings highlight buffer erosion / Project delays • Preventing the causes of delay will speed up your Projects • Your process of ongoing improvement is simply to eliminate the causes of delay by following up on the issues highlighted in Buffer Management meetings • As your Projects run faster and more reliably, continue to eliminate more and more causes of delay