Download
1 / 16
160 likes | 175 Views
This project analyzes the Rudd Creek watershed and detention basin in Farmington, Utah to determine the 100-year flood and if the basin will overtop. The study also provides preliminary flood plain estimates for undeveloped land.

E N D
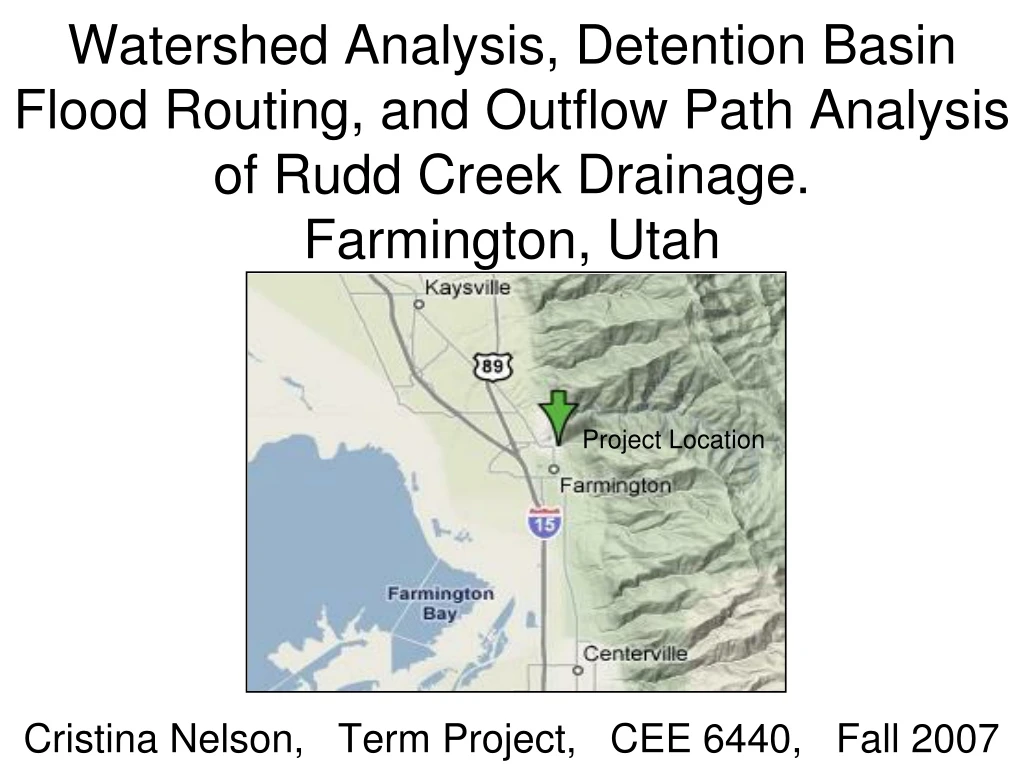
Watershed Analysis, Detention Basin Flood Routing, and Outflow Path Analysis of Rudd Creek Drainage.Farmington, Utah Project Location Cristina Nelson, Term Project, CEE 6440, Fall 2007
Rudd Creek Detention Basin
Background • The Rudd Creek canyon outlet is in a residential area on the East bench of Farmington City. • In 1983 a large flood and debris flow destroyed 35 homes, causing 3 million dollars in damages. • In 1984 an emergency detention basin was built at the canyon mouth, Berms were built along some roads, and new development in the area was restricted. • Recently Farmington City has been asked to open development for land parcels near the canyon mouth. • City officials believe the Basin will overtop in the 100 year storm.
Objectives: Study the Rudd Creek watershed and the detention basin to determine the100 year flood and if the Basin will overtop. Also, make preliminary flood plain estimates for the undeveloped Land. Methods: - Delineate Watershed - Calculate 100 Year Maximum Flow Rates - Create Basin Flood Routing Model - Determine if Basin will Overtop in 100 year flood - Detention Basin maximum outflow rate and drainage paths.
GIS Data Sources GIS Analysis • 5 meter resolution DEM (AGRC) • 1 ft Orthophotographic image (AGRC) • Terrain Analysis - Watershed delineation • Spatial Analyst • Slope analysis • Statistics and Histograms • Hill shade • Networks • Length and weighted Slope of Longest flow path
Arc-Hydro 9 Tools: Terrain Analysis • Trim DEM to Study Area (Extract by Mask) • 5 meter DEM reconditioning (fill sinks * burn in streets) • Flow Directions • Flow Accumulation • Stream Definition & segmentation • Catchment Delineation and processing • Drainline Processing
Watershed Delineation • Batch Point Watershed Delineation (At Detention Basin) • Results: - Drainage area = 0.77 mi2 • - Weighted Average Watershed Slope = 42% • - Weighted Average Stream Slope = 46.6 % • - Longest drainage Path = 13,287 ft long
100 Year Flood Event Rational method Qmax =CiA • I is the rainfall intensity (IDF Curves) • A is the drainage area = 0.77 square miles • Where C is the runoff coefficient. • C is usually determined from land cover tables. • This approach does not work well for steep mountain watersheds. • Less infiltration times on steeper slopes leads to greater C values • C is primarily a function of Slope, at slopes greater 10% • Rudd Creek watershed is too steep (42% average slope)
Runoff Coefficient Research Paper: “Rational Coefficients for Steeply Sloped Watersheds” (Cutter & McCuen, 2007) Where: -Co is the runoff coefficient at a 6% slope -S is the Slope -n is the manning's value Slope function in the Spatial Analysis was used to create a histogram of slopes classes versus area.
Slope Class Histogram Area Slope (%) Classes Runoff Coefficient Used slope class histogram to calculate a weighted average C for the watershed C = 0.67
Overland Flow Channel Flow Intensity • Intensity was determined from Farmington City Engineer’s IDF Curves. - Frequency = 100 year storm • Duration is equal to the time of concentration (Tc) • Tc was calculated from longest drainage path length, slope, and estimated channel characteristics to be used in Manning’s Equation. Tc = Tt1 = Tt2 Tc = 15 min. I = 3.68 (in/hr) Qmax=CIA = 1,200 cfs
Detention Basin Flood Routing Model Model Applied using Step Method in a Spreadsheet • Basin Influent Qmax = 1,200cfs, - Estimated influent hydrograph • Detention capacity 14 acft, Depth as a function of Storage equation • Model Outlet structures to determine Outflow hydrograph • Low level outlet pipe Capacity 50 cfs, piped to the river. • Emergency overflow spillway capacity 1000 cfs, modeled as a weir with known spillway dimensions. Peak Outflow Q Pipe = 50 cfs Q Spillway = 880 cfs Q Total = 930 cfs Thus Basin embankment is not overtopped in 100 year storm.
Flood Mapping • Need more detailed DEM and surveyed cross section to create a HEC-RAS based Flood Map • For the purpose of this project, simplistic methods were used to estimate the flow path of the discharge out of the emergency spillway to Farmington Creek • 5 meter DEM • Streets and other known smaller flow paths burned into DEM With AGREE DEM reconditioning • Flow path Tracing
Conclusions and Recommendations • Watershed 100 year flow, Q = 1200 cfs • Max basin outflow Qout = 930 cfs • Basin will not be overtopped in 100 year event • Some of the undeveloped area is effected by the flow path predictions. • The area may be able to opened for development if a Berm is created to contain flow to the streets near 500 North and Main Street. • More accurate flood plain mapping data and analysis is still needed. • Better estimates of the shape of the Basin’s influent hydrograph could be made by studying adjacent watersheds.