Download
1 / 45
450 likes | 533 Views
Modeling and Segmentation. Telecommunications Industry 2007 GSU-MGS8040. Presentation Subtopics. Telecom History Scope of Presentation Modeling Scoring & Tracking Segmentation What’s Next?. Telecom History. Telecom History. Pre-divestiture AT&T Little innovation No competition

E N D
Modeling and Segmentation Telecommunications Industry 2007 GSU-MGS8040
Presentation Subtopics • Telecom History • Scope of Presentation • Modeling • Scoring & Tracking • Segmentation • What’s Next?
Telecom History • Pre-divestiture AT&T • Little innovation • No competition • No price pressure • Divestiture 1974-1982 • USDoJ split AT&T in return for entry into computers • AT&T split into 7 Regional Bell Operating Companies (RBOC) • Ameritech Corporation • Bell Atlantic Corporation • BellSouth Corporation • NYNEX Corporation • Pacific Telesis Group • Southwestern Bell Corporation • U S West, Inc.
History (continued) • Divestiture 1974-1982 (continued) • Surge in long distance competition • Sprint, MCI, AT&T, BellSouth, Verizon, Quest • LD prices drop • Local monopolies remained • local prices rise/static • Telecommunications Act 1996 • State-by-state Uniform national law • Meant to promote competition • Incumbent Local Exchange Carriers (ILECs) made network elements available to Competitive LECs (CLECs) at cost plus regulated wholesale • LECs gained ability to provide LD services • Lead to consolidation of major media companies (80 > 5)
Evolution of Telecom Companies From Wikipedia
New Competitive Challenges • New Technologies - Convergence • Cellular Phone – Messaging, E-mail, Ring Tones, TV/Video feeds • Wireless Communication/Data • VoIP • Internet Access • ISDN, DSL, T1 • Cable • Cable/Wireless partnerships • Television/Video (new) • Bundle strategies
Presentation Scope • Single ILEC providing B2B landline products and services • ~1.2M business customers, ~ 2.4M lines • 1 - 200 employees • 1 - 50 lines • 1 - 10 locations • Top 5 industries: Retail, Wholesale, Business Services, Manufacturing, Healthcare • ILEC uses a three channel approach to the market including Inbound centers, Outbound sales and Sales Agents.
Why Model • Increase Profitability • Ameliorate line losses • CLEC competition • Cellular • Sales targeting: outbound and Inbound, based on customer behavior/attributes • New product development and advertising strategies • Efficient use of marketing and sales resources • Segmentation Strategies: Identify groups of customers based on predictions of their possible business needs
Telecom Modeling • Statistical propensity modeling is the backbone of telecom segmentation and offer strategy • Every customer is scored by each model (probability and L, M, H score) • Models have been built and continuously updated for all key products (Bundles, DSL, Lines, Line Add-ons, LD, T1, Direct Internet Access, complex data, complex voice, wireless, hosting, inert customers, customer vulnerability/churn, and growth index) • Predominantly logistic regression models - 70 variables initially, with 5-10 in the final model • Sales improvement from the use of models varies from 20-50%, over no targeting
Automated Data Sourcing/Flow Sales Quotas and Targets Billing Modeling & Reporting Datamart List Generation Product Usage • Automated Acquisition • Unit of Analysis • Matching • Cleaning • Conflict Resolution • Business Rules • History • Summarize • Calculated Variables Targeting Service, Maintenance Advertising & Sales Campaigns Tracking Monthly Processing Trouble Reports New Product Strategy Campaign Tracking Reporting – Scheduled, Ad hoc Contracts Data Views Modeling & Scoring 3rd Party - D&B, InfoUSA Scores, Segments
Modeling & Scoring Flow Store, Clean, Dummy variables, Categorize, Standardize, Calculate new variables, Summarize Modeling & Reporting Datamart Views SAS Enterprise Miner Insert Refresh Models, New Models, Ad hoc Models Score Customers Monthly
Data for Modeling • Snapshot of customer data for the most current month • Total of 350-400 variables • Customer history (3-6 months) for some variables • Aggregated with summary functions (mean, min, max, etc.) • Data cleaning • Null, 0, Missing, Blanks • Impute • Bad values (out of range, wrong type, subjectivity) • Outliers • Transformations • Offsets • Calculated variables • Other pre-processing – decision trees, factor analysis, etc. • SAS Enterprise Miner
Dataset Drill-Down Variable labels intentionally covered
Automated Scoring • Score ~1.2M customers for each of ~ 25 models x 2 variants/model x 1-4 updates/refreshes per year > 120 models/year • Customers scored with 2 values: probability (0.0-1.0) & score (L, M, H) for each model/variant • SAS code (32,354 lines ) - modularized, optimized for ease of maintenance and to some degree, speed • Declare global macro variables • Date • Product mean revenue • Declare Libnames • Establish OLEDB connection with remote database (SQL Server 2005) • Connection/references to local subdirectories • Code • Raw Data • Scores • Prep for new data – delete datasets from previous month’s processing • Retrieve data • Connect to views and read data from remote server into local datasets • Clean data, create calculated variables • Launch scoring modules • Score customers for ~50 models • Store scores locally • Save scores to remote server
Scoring Process (%include files) Model 1 Scoring Code File Master File SAS Pseudo-Code Data scores.model1; Pre-scoring Code set raw_data.cust; Model 1 Scores * … run; Model 2 Scores SAS Processing Flow Modeling Platform Model 3 Scores Model 2 Scoring Code File … Model N Scores Data scores.model2; set raw_data.cust; Post-scoring Code … run; * %include “code.Score_Model_1.sas”;
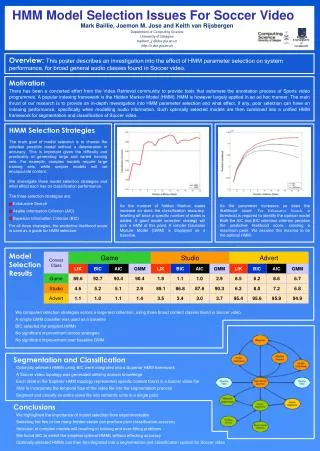
Monthly tracking with updating as needed Effectiveness Index (EI): actual sales compared to average sales rate EI: multiplier showing how effective the model is. E.g. Product B model shows that a customer scored “high” is ~3 times more likely to buy the product than an average customer Model differentiation: compare High vs Low EI values. E.g. For Products C-E, a customer scored “high” is more than 7 times more likely to buy that product than one scored “low” Average for Base Tracking Model Effectiveness
Why Segment • Increase Profitability • Targeting • efficient use of marketing and sales resources by targeting inbound and outbound sales • Messaging • development of targeted marketing communications (i.e., Hispanic language direct mail, women owned businesses) ensures messages reaches customers effectively • Future Needs • Identification of groups of customers based on their business needs, not bound by traditional telecom products
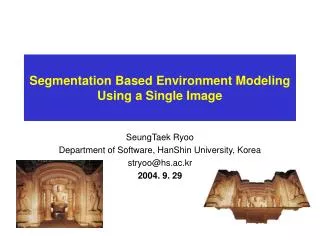
B2B Technology Retail/Service Small Stable Segmentation Evolution The segmentation process was continually evolved - moving from one dimensional models to multi dimensional schemes. Along the way, predictive modeling was added to the process to ensure the segmentation scheme was always actionable. Product Targeted Vulnerability Industry Value • Seg 1 • Seg 2 • Seg 3 • Seg 4 • Seg 5 • Seg 6 High Customer Complexity Vulnerability Low Customer Size Location One Dimensional Multi Dimensional 1997 2001 2006
Product Based Segmentation D E F Complex Products Simple A B C Low High Size
Segment Profiles Slide deliberately left blank.
Segmentation with Propensity Modeling • Add propensity modeling to the “static” segmentation scheme • Re-categorize customers into Segments • Identify migrations from one segment to another • Identify customer growth areas/products • Promote stewardship for customer growth • Anticipate new needs • Develop new products
Needs Based Segmentation (Product Migration Paths) D E F Complex Products A B C Simple Low High Size
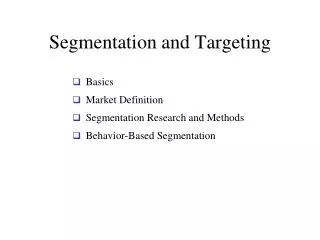
Additional Dimensions D2 E2 F2 Complex D1 E1 F1 Products n A1 B1 C1 Third Dimension Simple Locations 1 Low High Size
What’s Next? • Accommodate increased customer base (due to merger) and increased geographic footprint • More products, more new product development • Bundles • Television/Video • Etc. • Shifting competitive landscape • Cable • New partnerships • Revisit segmentation complexity (product) and size axes • Evolve segmentation strategies • Growth Index Lifetime value • Other
Growth Potential/Index • Customer’s Current Products and Value • Product A x Revenue for A + • Product B x Revenue for B + • Product F x Revenue for F = X Current Value • Customer’s Potential Products and Value • Product A x Revenue for A + • Product B x Revenue for B + • Product C x Revenue for C + • Product F x Revenue for F + • Product G x Revenue for G = Y Potential Value Y – X = Growth Potential/Index
Customer Lifetime Value • CLV - value of a customer over the entire history of customer's relationship company • Acquisition cost • Churn rate • Discount rate • Retention cost • Time period • Periodic Revenue • Profit Margin • Possibly include Satisfaction & Loyalty ?
Acknowledgements • Special thanks to Tim Barnes & Sam Massey, AT&T - 2007
Contact Information David Pope, Ph.D. Intelligent Strategies and Information Solutions, Inc. www.intelligentstrategies.com 770.271.9159