Download

1 / 22
220 likes | 335 Views
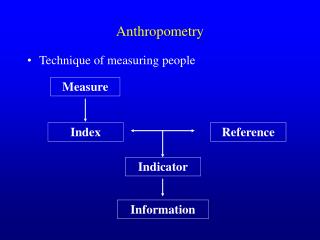
What factors are most responsible for height?. Model Specification. Outcome = (Model) + Error. ERROR??? measurement error m odel error analysis unexplained u nknown u naccounted for missing variables . Analytics & History: 1st Regression Line.

E N D
Model Specification Outcome = (Model) + Error ERROR??? measurement error model error analysis unexplained unknown unaccounted for missing variables
Analytics & History: 1st Regression Line The first “Regression Line”
X4 X3 X5 Y X1 X2
we find that a 54-loci genomic profile explained 4–6% of the sex- and age-adjusted height variance the Galtonian mid-parental prediction method explained 40% of the sex- and age-adjusted height variance
> getwd() [1] "C:/Users/johnp_000/Documents" > setwd()
Dataset Input Object Function Filename
str() summary() Data Types: Numbers and Factors/Categorical
head() summary() ece ece
Outcome, Dependent Variable (Y-Axis) Outcome, Dependent Variable (Y-Axis) Smartphone? Yes or No Child’s Height Continuous Categorical Histogram Pie Bar Continuous Cross Table Scatter Frequency Predictor Variable (X-Axis) Parents Height Mosaic Cross Table Categorical Boxplot Gender 1 Logistic Regression Linear Regression Regression Model 0
Frequency Distribution, Histogram hist(heights$childHeight)
Standard Deviation Mean
Calculating Standard Deviation - sd() • Deviation between mean and an actual data point.
Normal Distribution and SD Mean = 66.5 S.D. = 3.6 66.5 - 7 = 59.4 66.5 + 7 = 73.6
Density Plot plot(density(h$childHeight)) Area = 1
Mode, Bimodal hist(h$childHeight,freq=F, breaks =25, ylim = c(0,0.14)) curve(dnorm(x, mean=mean(h$childHeight), sd=sd(h$childHeight)), col="red", add=T) Bimodal: two modes