Download
1 / 58
580 likes | 685 Views
Explore the potential role of imported LNG in the Northwest with a focus on the Bradwood Landing terminal and LNG safety. Discover NorthernStar Natural Gas' commitment to providing safe and affordable gas supplies. Learn about LNG safety facts and its remarkable industry history globally. Understand the importance of LNG imports for the Pacific Northwest's natural gas supply mix. Stay informed about the current and future landscape of natural gas demand and supply in North America.

E N D
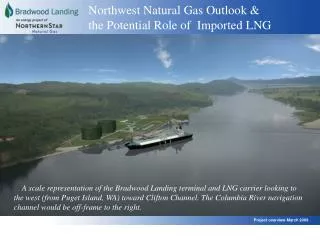
Northwest Natural Gas Outlook & the Potential Role of Imported LNG A scale representation of the Bradwood Landing terminal and LNG carrier looking to the west (from Puget Island, WA) toward Clifton Channel. The Columbia River navigation channel would be off-frame to the right. Project overview March 2009
About NorthernStar Natural Gas and Bradwood Landing U.S.-owned and -managed, with two LNG projects under development, including Bradwood Landing. Focused on the development of domestic LNG terminal projects. Committed to providing a safe, affordable and environmentally superior solution to the growing need for additional natural gas supplies on the West Coast. Founded by principals who have been involved in the development of more than 50 energy infrastructure projects, including the development, construction and operation of nine LNG projects worldwide.
What is LNG? What is LNG? Liquefied Natural Gas LNG is natural gas, cooled to -260° F to make its transportation easier and cheaper.
LNG safety facts LNG is safe: • LNG is non-polluting. • LNG is not stored under significant pressure and is not explosive. • LNG is odorless, non-toxic and non-corrosive. • LNG is lighter than water and natural gas (its vapor form) is lighter than air above -160° F. • LNG leaves no residue after it evaporates. • LNG is a liquid that won’t burn until it becomes a vapor, and the vapor won’t burn until it mixes with air and becomes diluted to between 5% and 15% LNG vapor in air. Above 15%, there’s not enough air for it to burn, and below 5% there’s not enough LNG vapor to burn. LNG vapor clouds burn when they are in the 5-15% dilution range, but they don’t explode. U.S. Coast Guard tests have demonstrated that unconfined LNG vapor clouds do not detonate, they only burn.
Safety first: an industry history LNG has a remarkable safety record worldwide: More than 40 years of safe operations at LNG-receiving facilities Not a single serious injury to a member of the general public More than 40 LNG-receiving terminals operating around the globe. Not one has had an accident affecting the general public Many of these facilities are located in densely populated areas in Europe, Asia and the U.S. Japan & Korea have imported most of their natural gas in the form of LNG for the past quarter-century.
LNG in the U.S. There are 113 active LNG facilities in the U.S. Five import terminals operate in the Eastern and Southern U.S. • Everett, Massachusetts • Cove Point, Maryland • Elba Island, Georgia • Lake Charles, Louisiana • Gulf Gateway Energy Bridge, Gulf of Mexico
LNG is not new to the Northwest – Portland and Newport, Oregon There are two “peak-shaving” LNG storage facilities in Oregon, which are single containment facilities. They provide natural gas during periods of peak consumer demand. Portland, Oregon (GASCO) Owner: Northwest Natural Size: 0.6 Bcf Year built: 1969 Located five miles north of downtown Portland. Newport, Oregon Owner: Northwest Natural Size: 1.0 Bcf Year built: 1979 Located on a point of industrial land that juts into Yaquina Bay. 7
North America National Gas Demand 77.4 Bcfd Source: Wood Mackenzie
US National Gas Demand Source: Wood Mackenzie
Imported Gas Remains Important to Supply Mix • LNG imports increase at a rapid pace in the first decade of the projection • However, “the future direction of the global LNG market is one of key uncertainties in the AEO 2009 reference case” Source: EIA, 2009 Early Release
The Pacific NW needs additional supplies of natural gas There have been nine independent assessments of regional and North American gas supply and demand within the past two years. Their conclusions: the region needs natural gas supplies
The facts of PNW gas supply • The Pacific NW imports 100% of its natural gas. Gas comes from British Columbia, Alberta, Wyoming, Colorado and New Mexico. • 2/3 of the NW’s natural gas comes from Canada. Canadian supply is declining, while Canadian demand is increasing, severely diminishing export capability to the U.S. • 1/3 of the NW’s natural gas comes from the U.S. Rockies. The Rockies Express (and other new pipelines) will allow diversion of that gas to higher-priced east coast markets beginning in 2009. • Although more gas and wind power plants are being built in the region, most of the new power actually being generated is coming from gas. 13
Forecast of Canadian supply Canadian supply expected to drop significantly due to production decrease and growth in Canadian domestic demand driven by tar sand oil production. Projected Decrease of Approximately 4,600 MMcf/d from 2006 to 2025 Forecast Source : EIA 14
New pipeline will carry gas east Supplies in the Rockies will have access to east coast markets - potential for 2.5 Bcf/d total capacity on Rockies Express 15
More gas-fired power plants and wind turbines are being built Source: NW Power and Conservation Council Since 1999, more gas–fired plants have been built in the Northwest. This table represents the “name plate” energy capacity of new power plants brought on line. 16
… but gas is providing more actual power Source: NW Power and Conservation Council Among new power plants, gas is providing most of the actual power. 17
Regional gas utilities agree on supply need In January 2008, the CEOs of NW Natural, Cascade Natural Gas and Avista Corp. wrote Gov. Kulongoski on the pressing need for additional supplies of natural gas. They cited the following facts: • Since 2000, NW regional wholesale natural gas prices have risen 200%. • Gas is the only immediately available and reliable way to meet our region’s growing demand for electricity, while reducing greenhouse gas emissions. • An LNG terminal in Oregon would increase access and improve long-term reliability of natural gas supply and diversify supply sources to help keep costs competitive.
Pacific Northwest Gas Demand - Increasing ….while PNW demand continues to increase Source: Northwest Gas User Association
Oregon and Washington’s growing demand for natural gas – supply and demand Customer Growth • According to utility projections, the number of Oregon utility core market natural gas customers will grow over the next 20 years at an average annual compounded rate of 2.4%, with a cumulative increase of 66.2% or by 478,674 customers through 2028. • Washington’s utilities project the number of their core market natural gas customers to grow at an average annual compounded rate of 2.25%, with a cumulative increase of 55.2% or by 626,962 customers over the same period. Demand Growth • Utility core market annual demand over a 20-year forecast period is expected to experience cumulative increases of approximately 40 - 50% in Oregon and Washington, representing an additional demand of roughly 30 Bcf in Oregon and 66 Bcf in Washington. (Based on utility Integrated Resource Plans already filed with Oregon and Washington’s public utility commissions ) • Over the same period, peak day demand in Oregon and Washington is forecasted to increase by 35% and 50%, representing a cumulative increase of 0.35 Bcf/d and 0.78 Bcf/d, respectively.
Oregon and Washington’s growing demand for natural gas – looming shortfalls The demand and supply dynamics on the previous slide will result in the following projected shortfalls in available natural gas unless additional supplies are made available to the region. Supply Shortfalls • All of Oregon’s and Washington’s natural gas utilities conclude that currently committed supply and capacity resources are inadequate to serve future peak day natural gas demand. • NW Natural foresees shortfalls as early as the winter of 2008-09. • Cascade Natural Gas projects shortfalls on its system in the 2010-11 winter heating season. • Avista states that it will face peak day deficiencies in Oregon by the 2011-12 winter and in Washington, by the 2014-15 winter heating season. • Puget Sound Energy concludes that its currently committed resources will become inadequate to serve its peak day (Washington) natural gas requirements beginning with the 2011-12 winter heating season.
PNW Supplies Remain Flat WCSB exports are projected to decline at a similar rate to Rockies production increase. The Pacific Northwest will have no increase in natural gas supply sources..…. WCSB Rockies Source: Wood MacKenzie
Natural Gas Volatility and Price • Natural gas prices have experienced unprecedented volatility Source: NYMEX • Diversity of supply whether through drilling (unconventional or conventional) or through LNG imports throughout the US will ensure that both prices and volatility remain low.
Direct supply will help lower costs No one will pay higher prices for imported LNG. The price in the local market is set in the local market. Whatever the cost of producing and shipping LNG, the supplier will have to sell at local prices. Additional supply options will help keep prices down. 24
US production remains steady Henry Hub • Robust unconventional gas production serves to hold overall production steady as conventional production declines • Alaskan pipeline is a wildcard post 2020 • Prices projected to increase as a result of higher exploration and development costs and a requirement for increased production Source: EIA, 2009 Early Release
Cost Curve Based on 2008 Costs and Volumes 64.2 Bcfd Demand equals $5.00/MMBtu HH gas • Per 2009 EIA AEO Early Release, US demand was 64.2 Bcfd in 2008 Source: Wood Mackenzie
Shale gas can fill immediate supply gap, but at a higher cost
LNG can help meet OR’s energy needs “Liquefied Natural Gas must be considered in the context of diversifying and shoring up energy supplies for Oregon and the Pacific NW and the potential for LNG to help reduce over-reliance on other sources of energy, especially coal and hydropower which have other environmental impacts. LNG must also be considered in light of its potential to serve as part of an essential “bridge” to a future energy portfolio that is more dependent on renewables. In this context, all sources of clean energy should be considered if they have potential to increase supply, assure supply and price stability and reduce reliance on foreign energy.” - Gov. Ted Kulongoski, Memo on LNG, Nov. 16, 2007, pgs 1-2. 28
LNG is far “cleaner” than coal Total Greenhouse Gas Emissions Summary (Tons CO2 per Megawatt hour) Source: Comparative Life-Cycle Analysis of GHG Emissions from Select Hyrdocarbon Fuels, PACE Global Energy Services, May 2007. On a life-cycle cost basis, LNG has less than half the CO2 content of domestic coal and only slightly more than domestic natural gas. In addition, unlike coal, there are no mercury emissions from the burning of natural gas. 29
An LNG Terminal could provide significant savings to gas consumers 2008 IRP Summary Results (savings over 20 years in present value dollars) $9.4 $9.2 $9.0 $8.8 $8.6 $8.4 $8.2 $8.0 Preferred Plan (Palomar East) Northern OR LNG option New Rockies pipeline No additional resources Southern OR LNG option NW Natural’s modeling shows that an LNG terminal could save consumers hundreds of millions of dollars in transportation-based cost savings from LNG supply.
Oregonian endorsement On June 15, The Oregonian published an editorial calling for the Bradwood Landing project to proceed.
Bradwood Landing key data A scale representation of the Bradwood Landing terminal looking to the Southeast from the western tip of Tenasillahe Island showing Clifton Channel. The Columbia River is at the left. 35
Why Bradwood is an excellent site • Bradwood offers a sheltered, deep water port and requires a shorter pipeline to connect with existing natural gas lines. • Shorter 36.3 mile pipeline allows for faster construction time and lower transportation costs to move gas to OR and WA consumers. • The site has a 150+ year history as an industrial site including use as a lumber mill, mill town and deep water port. • There is no tsunami risk. • There is no risk of contamination to human or aquatic life from turning basin dredging because no toxins are present. • It is a remote site that will not impact other existing civic infrastructure such as airports or cities. 36
Bradwood Landing:1856-1965 Industrial History BELOW: Bradwood today viewed from the air looking west. The oval represents the area that would be used for the Bradwood Landing terminal. ABOVE: Bradwood was an industrial site from 1856-1965. The site housed a lumber mill, company town and deep water port. Pictured above in 1954. 37
BWL is designed to deliver gas to PNW • Oregon consumers would receive on average 73% of all LNG delivered to consumers from the Bradwood facility. • Washington would receive 26% of all LNG delivered. • Less than 1% on average would go to Idaho, Northern California and Nevada combined. Source: An Independent View of Markets Served by Bradwood Landing, Wood Mackenzie, July 2007. We contracted an independent study to examine where the physical gas flows from our terminal will go. At an expected terminal utilization of 40% (industry average): 38
BWL is designed to deliver gas to PNW • Oregon consumers would receive on average 50% of all LNG delivered to consumers from the Bradwood facility. • Washington would receive 30% of all LNG delivered. • 20% on average would go to Idaho, Northern California and Nevada combined. Source: An Independent View of Markets Served by Bradwood Landing, Wood Mackenzie, July 2007. We contracted an independent study to examine where the physical gas flows from our terminal will go. At an expected terminal utilization of 100%: 39
River traffic and the U.S.C.G. Waterway Suitability Report for Bradwood Landing • The Columbia River is the main import and export highway for many products Oregon and Washington consume, grow and manufacture. It is vital to commerce. • Vessels carrying more volatile cargoes than LNG (gasoline, diesel, anhydrous ammonia, fertilizer and chemicals) are routine on the Columbia River and are not subject to the same safety and security measures as LNG vessels. • U.S. Coast Guard determined that with improvements to navigation, safety and security the Columbia River is suitable for LNG carriers. • Bradwood will pay for all safety, security and navigation upgrades. • LNG carriers will not adversely affect river traffic. LNG vessels will transit the river much like other deep draft vessels on the river today. • USCG to “routinely” allow other vessels to transit through the safety/security zone.
LNG carrier traffic in context At an estimated maximum of 125 LNG carrier visits per year, deep draft vessel traffic on the Columbia would still be lower than it has been.
LNG ships: among the strongest in the world • LNG carriers are double-hulled, and their cryogenic tanks provide a third level of containment. • Since the first LNG cargo was transported by ship in 1959: • More than 48,000 cargoes of LNG have been delivered. • There has never been a cargo containment failure. 42
Large ships on the Columbia River today LNG carriers are similar in size to other large deep-draft vessels that transit the Columbia River today.
In-transit safety/security zone • Safety/security zone defined: • The area surrounding an LNG vessel that another vessel will need permission from the Coast Guard to enter: • 500 yards while the ship is in transit • The safety/security zone does not apply to swimmers, does not extend onto land, nor will it affect Clifton Channel.
At berth safety/security zone • 200 yards while the ship is berthed • (access to Clifton Channel • will not be blocked) • 50 yards at the facility when no ship is present The Coast Guard stated in its Waterway Suitability Report that it expects to grant “routine” permissions to enter safety/security zones to other commercial vessels, fisheries and recreational river users. Waterway Suitability Report for Bradwood Landing LNG, USCG, February 28, 2007, page 1.
Bradwood Landing will be a national model of environmental sustainability Avoid & Minimize adverse impacts of the project to the greatest extent feasible: shrinking the facility footprint, protecting sensitive areas, designing new solutions. Compensate for unavoidable impacts with mitigation that creates verifiable “net benefits” (monitored by FERC and NOAA). Enhance, beyond regulatory requirements, fish productivity and the Lower Columbia ecosystem and support sustainable principles and processes. 46
Svensen Island purchase As part of our mitigation plan, Bradwood Landing has acquired Svensen Island and will breach the remaining dikes to return the lower third of the island to its original salmon habitat. 49