Download
1 / 5

E N D
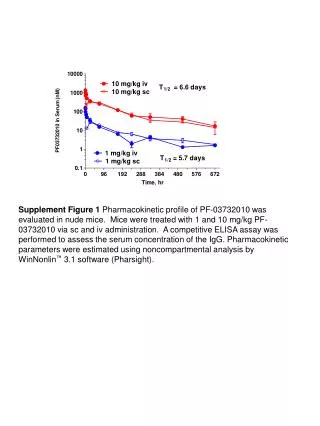
Supplement Figure 1 Pharmacokinetic profile of PF-03732010 was evaluated in nude mice. Mice were treated with 1 and 10 mg/kg PF-03732010 via sc and iv administration. A competitive ELISA assay was performed to assess the serum concentration of the IgG. Pharmacokinetic parameters were estimated using noncompartmental analysis by WinNonlin™ 3.1 software (Pharsight).
Supplement Figure 2 The selectivity of PF-03732010. Coat each well of the ELISA plate (Exiqon protein immobiliser plates, VWR International) with 50µl antigen (human P-Cadherin:Fc, E-Cadherin:Fc, N-Cadherin:Fc, VE-Cadherin:Fc, and mouse P-Cadherin:Fc all from RnD Systems) at 1µg/ml in 1 x PBS + 0.5mM CaCl2 at 4oC. Block IgGs and control antibodies at a concentration of 10 µg/ml in blocking buffer (1 x PBS + 0.5mM CaCl2, 3% Carnation milk powder) for 1hr at RT. Wash the antigen coated plates once with 1 x PBS + 0.5mM CaCl2 and block each well with 200µl blocking buffer. Block plates for 1 hour at RT. Wash the antigen coated plates three times with 1 x PBS + 0.5mM CaCl2. Add 50µl blocked IgG /well according to the plate layout. Incubate at 4oC. Wash the plates three times with 1x PBS / 0.1% Tween + 0.5mM CaCl2 then three times with 1 x PBS + 0.5mM CaCl2. Add 50 µl of the detection antibody (Anti-human IgG (Fab specific)-HRP, Sigma (Cat# A0293) diluted 1:10,000 in blocking buffer. Incubate plates at RT for 1 hr. Wash plates three times with 1 x PBS / 0.1% Tween + 0.5mM CaCl2 and three times with 1 x PBS + 0.5mM CaCl2. Tap plates dry and add 50 µl/well of TMB (3,3’, 5, 5’-Tetramethylbenzidine, Sigma # T-0440). Once developed, add 25 µl/well 0.5M H2SO4 to stop the reaction. Read plates on Wallac Victor at 450nm.
MDA-MB-231 MDA-MB-435HAL PC3M CDH3 CDH3 CDH3 pCL pCL pCL P-cadherin Actin 4T1 PC3M HCT116 DU145 H1650 CDH3 CDH3 pCL pCL P-cadherin Actin Supplement Figure 3 P-cadherin expression level in the tested cell lines.
P-Cadherin β-Catenin β-Catenin/DAPI E-Cadherin Caspase 3 Vehicle PF-2010 20 mg/kg Supplement Figure 4 Imunofluorescence and IHC analysis of P-Cadherin, β-catenin, merged β-catenin/DAPI, E-cadherin and caspase 3 staining in DU145 tumors. Diminished levels of P-cadherin and β-catenin, as well as increased caspase 3 activation was observed with the treatment of PF-03732010 at 20 mg/kg . Change in E-cadherin expression was not detected with the treatment. Images are at 40X magnification for all markers except caspase 3 (10X).
MDA-MB-435HAL-pCL Vehicle Intensity PF-03732010, 20 mg/kg 0 21 41 -1 Rx Days after Tumor Implant A B Vehicle Vehicle PF-2010 PF-2010 C D Supplement Figure 5 PF-03732010 displays no antitumor and antimetastatic activity in the MDA-MB-435HAL-pCL SRC and experimental metastasis model. The procedures for tumor model set up and the administration of PF-03732010 (20mg/kg) was identical to those were described in Figure 3 and 4, respectively for direct comparison. Values in the line plots represent Mean ± SEM from 12 mice. (A) In the MDA-MB-435HAL-pCL SRC model, line-plot of BLI outputs indicates that PF-03732010 showed no efficacy against the primary tumor growth in SRC. Selected images (dorsal view) of three representative mice via BLI imaging from vehicle and treated group were acquired on day 50. (B) In SRC model, PF-03732010 showed no efficacy against the secondary tumor growth in lung. Selected images (ventral view) of three representative mice via BLI imaging from vehicle and treated group was captured on day 50. (C) In the MDA-MB-435HAL-pCL experimental metastasis model, the BLI imaging of three representative mice depicts the disease progression and the treatment effect by 20 mg/kg PF-03732010 in the prophylactic model. Dosing was initiated at 24 hr before the tumor cell inoculation. (D) PF-03732010 (20 mg/kg) showed no impact on the tumor cell colonization, tumor burden growth in lungs and mouse survival time in the MDA-MB-435HAL-pCL experimental metastasis model.