Download
1 / 18
180 likes | 302 Views
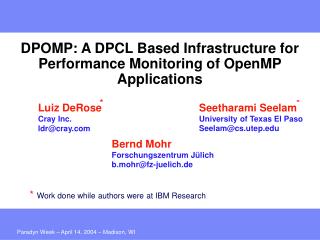
*. *. Luiz DeRose Cray Inc. ldr@cray.com. Seetharami Seelam University of Texas El Paso Seelam@cs.utep.edu. DPOMP: A DPCL Based Infrastructure for Performance Monitoring of OpenMP Applications. Bernd Mohr Forschungszentrum Jülich b.mohr@fz-juelich.de.

E N D
* * Luiz DeRose Cray Inc. ldr@cray.com Seetharami Seelam University of Texas El Paso Seelam@cs.utep.edu DPOMP: A DPCL Based Infrastructure for Performance Monitoring of OpenMP Applications Bernd Mohr Forschungszentrum Jülich b.mohr@fz-juelich.de * Work done while authors were at IBM Research
Outline • What is POMP • What is DPCL • IBM compiler and run-time library features that makes dPOMP possible • Implementation • POMP not supported features (and why) • Probe libraries • POMPROF • KOJAK • Conclusions
“Standard” OpenMP Monitoring API? • Problem: • OpenMP (unlike MPI) does not definestandard monitoring interface • OpenMP is defined mainly by directives/pragmas Solution: • POMP: OpenMP Monitoring Interface • Joint Development • Forschungszentrum Jülich • University of Oregon • Presented at EWOMP’01, LACSI’01 and SC’01 • “The Journal of Supercomputing”, 23, Aug. 2002.
User Program Profiling Library MPI Library MPI Library Call MPI_Send MPI_Send MPI_Send MPI_Send PMPI_Send PMPI_Send Call MPI_Bcast MPI_Bcast MPI_Bcast What is POMP? • Portable cross-platform/cross-language API to simplify the design and implementation of OpenMP tools • POMP was motivated by the MPI profiling interface (PMPI) • PMPI allows selective replacement of MPI routines at link time • Used by most MPI performance tools • VampirTrace • MP-Profiler
A Brief History of OpenMP Instrumentation • POMP1 OpenMP performance monitoring interface • Forschungszentrum Jülich, University of Oregon • Published at "The Journal of Supercomputing", Vol. 23, 2002. • European IST Project INTONE • Development of OpenMP tools (includes Monitoring interface) • Pallas, CEPBA, Royal Inst. Of Technology, Tech. Univ. Dresden • http://www.cepba.upc.es/intone/ • Intel KAI Software Laboratory (KSL) - POMP • Development of OpenMP monitoring interface inside ASCI • Based on POMP, but further developed in other directions • Joint proposal presented at EWOMP’02 • POMP2 == POMP
POMP Proposal • Three groups of events • OpenMP constructs and directives/pragmas • Enter/Exit around each OpenMP construct • Begin/End around associated body • Special case for parallel loops: • ChunkBegin/End, IterBegin/End, or IterEvent instead of Begin/End • “Single” events for small constructs like atomic or flush • OpenMP API calls • Enter/Exit events around omp_set_*_lock() functions • “single” events for all API functions • User functions and regions • Allows application programmers to specify and control amount of instrumentation
Example: Standard Instrumentation 1: int main() { 2: int id; 3: 4: #pragma omp parallel private(id) 5: { 6: id = omp_get_thread_num(); 7: printf("hello from %d\n", id); 8: } 9: } 1: int main() { 2: int id; 3: 4: #pragma omp parallel private(id) 5: { 6: id = omp_get_thread_num(); 7: printf("hello from %d\n", id); 8: } 9: } *** POMP_Init();*** POMP_Finalize(); *** { POMP_handle_t pomp_hd1 = 0;*** int32 pomp_tid = omp_get_thread_num();*** int32 pomp_tid = omp_get_thread_num();*** } *** POMP_Parallel_enter(&pomp_hd1, pomp_tid, -1, 1,*** "49*type=pregion*file=demo.c*slines=4,4*elines=8,8**");*** POMP_Parallel_begin(pomp_hd1, pomp_tid);*** POMP_Parallel_end(pomp_hd1, pomp_tid);*** POMP_Parallel_exit(pomp_hd1, pomp_tid);
Dynamic Performance Monitoring Interface for OpenMP • Collaboration with Forschungszentrum Jülich • Motivation: • POMP under review by the OpenMP ARB! • May take too long to be implemented (if accepted) • Approach • A POMP implementation based on dynamic probes • Built on top of DPCL • Modifies the binary with performance instrumentation • No source code or re-compilation required
Compiler generated Source code master thread main() { main() { all threads A@0L1 { POMP_Parallel_begin A() A() POMP_Functionl_enter POMP_Loop_enter xlf_DoPar POMP_Functionl_exit } } POMP_Loop_exit run-time library POMP_Parallel_end } A() { A() { OMP parallel POMP_Parallel_enter A@0L1@OL2 { OMP loop xlf_Par POMP_Loop_chunk_begin do I=start,end loop body enddo POMP_Parallel_exit OMP end parallel POMP_Loop_chunk_end } } } DPOMP Instrumentation • The IBM compiler and run-time library
DPOMP Usage • dpomp <pomp library> <exe> • Input parameters • <exe> OpenMP application (or mixed-mode) • <pomp-lib> POMP compliant monitoring library • List of user functions to instrument (optional) dpomp [-f function.lst] libpomp a.out
DPOMP Instrumentation • Amount of instrumentation can be controlled • By the tool builder • Set of POMP calls available in the monitoring library and/or • By the user • Environment variables • Events instrumented by default: • All OpenMP constructs • All user functions called in the main program • All MPI Calls • Once the instrumentation is finished, the modified program is executed
Limitations • 63 out of 68 POMP events supported ! • Limitations due to compiler issues • POMP_Loop_iter_(begin, or end, or event) • POMP_Implicit_barrier_(end, or exit) • OMP Parallel Loop NOT = OMP Parallel / OMP Loop • Compile Time Context (CTC) • hasFirstPrivate, hasLastPrivate, hasNowait, hasCopyin, schedule, hasOrdered, and hasCopypriv not available • Limitations due to DPCL issues • Loop iteration values (init, final, incr, chunk) • Other Limitations • C++ not support
POMP Profiler (POMPROF) • Generates a detailed profile describing overheads and time spent by each thread in three key regions of the parallel application: • Parallel regions • OpenMP loops inside a parallel region • User defined functions • Profile data is presented in the form of an XML file that can be visualized with PeekPerf
KOJAK POMP Library (Forschungszentrum Juelich) • POMP monitoring library which generates EPILOG event traces • Processed by KOJAK’s automatic event tracer analyzer EXPERT Location: How is the problem distributed across the machine? Call Tree: Where in the source code? In which context? Performance Property: Which type of behavior caused the problem? Color Scale: How severe is the problem?
EPILOG Trace Converted to VTF3 (FZ Juelich) • EPILOG-to-VTF3 • Maps OpenMP constructs into VAMPIR symbols and activities
Conclusions • DPCL based implementation of the POMP performance monitoring interface for OpenMP • Easy to use • Two POMP Libraries • KOJAK POMP Library • POMP Profiler Library • or build your own library