Download
1 / 15
150 likes | 259 Views
Explore link architectures with amplification and regeneration for efficient network design. Analyze hut selection models and node configurations for optimal network performance.

E N D
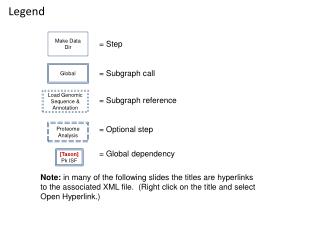
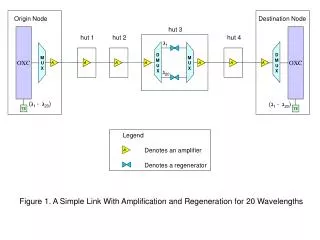
Legend Denotes an amplifier Denotes a regenerator A Origin Node Destination Node hut 3 OXC OXC hut 1 hut 2 hut 4 ג1 D M U X D M U X M U X M U X A A A A A A A ג20 (ג1 -ג20) (ג1 -ג20) TE TE Figure 1. A Simple Link With Amplification and Regeneration for 20 Wavelengths
link segment segment span span span Origin Node Destination Node A A A A 150km 150km 150km 150km 150km 150km Figure 2. A Link Architecture that Satisfies the Rule for a Link Budget of 150 km.
segment Origin Node O/E/O conversion Intermediate node 1 no O/E/O conversion Intermediate node 2 no O/E/O conversion Destination Node O/E/O conversion DPMD1 DPMD2 DPMD3 fiber type 1 fiber type 2 fiber type 3 d1 km d2 km d3 km Figure 3. Example of Fibers with Different DPMD Values in a Single Segment
Link and segment span span span Amplification Glassthrough Amplification Origin Node O/E/O conversion Destination Node O/E/O conversion hut 1 hut 2 hut 3 62 km 64 km 55 km 73 km 119 km Figure 4. Amplification Requirements using a Link Budget of 120
{supply} { 0 } { d1 } { d2 } { dn } { dn+1 } Origin Node With Amplification hut 0 Destination Node With Amplification hut n+1 x0 x1 x2 x3 hut 1 hut 2 hut n y2 y1 yn yo yn+1 Sink {demand} { -∑idi } Figure 5. Hut Selection Network Model
hut 1 hut 2 hut 13 hut 14 hut 15 Node 1 112 112 76 3 75 75 75 25 5 65 100 120 hut 20 hut 29 65 hut 9 hut 21 90 distance 120 hut 28 65 hut 22 hut 10 80 65 hut 27 hut 23 120 70 65 hut 26 hut 11 hut 24 60 hut 4 hut 5 hut 6 hut 7 40 55 hut 17 hut 18 2 100 100 100 100 30 4 120 120 30 6 Figure 6. Example Network
1 3 5 2 4 6 Figure 7. Demand Routings
215 TEs Node 1 300 TEs Node 3 140 TEs Node 5 145 λ s 100 λ s 55 λ s 40 λ s 70 λ s 25 λ s 110 TEs Node 4 30 λ s 70 TEs Node 6 95 TEs Node 2 Figure 8. The Opaque Network Design (930TEs, 37As, 18 MUX/DMUX, Total Cost = 79,920)
TE TE TE TE TE OXC OXC 40 A 80 A 80 A 80 80 A A TE Node 1 Node 2 Local Ports Local Ports TE TE TE TE TE OXC OXC 80 80 A A 40 A 80 A 80 A 20 A 80 A 40 A Local Ports Node 4 Node 3 TE TE Figure 9. Opaque Network Design Node Architectures for Nodes 1 - 4
TE OXC OXC 80 A 40 40 A A 40 A 20 A TE TE TE TE Local Ports Node 5 Local Ports Node 6 Figure 10. Opaque Network Node Architectures for Nodes 5 and 6
75 TEs Node 1 100 TEs 25 Rs Node 3 60 TEs Node 5 145 λ s 100 λ s 55 λ s 40 λ s 70 λ s 25 λ s Node 4 30 λ s 70 TEs Node 6 95 TEs Node 2 Figure 11. The All-Optical Network (400TEs, 100Rs, 39As, 22 MUX/DMUX, Total Cost = 54,530)
OXC OXC 80 40 A A 80 A 80 80 A A TE TE TE TE Node 1 Node 2 Local Ports Local Ports OXC OXC 80 A 80 A 40 A 80 A 80 A 20 A 40 A 80 A Local Ports Node 4 TE TE Node 3 Figure 12. All-Optical Node Architectures for Nodes 1 - 4
40 OXC OXC 80 A 40 40 A A A 20 A TE TE TE TE Node 5 Local Ports Node 6 Local Ports 80 80 80 80 A A A A 80 20 Hut 1 Hut 14 Figure 13. All-Optical Node Architectures
AL BO SA CH SL PL NY OM SF CL LV DE IN WA KA RA NA ME LA PH AT DA EP HO JA NO TA SO Figure 14. US Test Network
CD4 CD1 WA1 OR1 CD2 CA3 CD3 CA4 IL1 NY3 CA5 WY1 IL2 UT1 NE1 NY1 NV1 NY2 CO1 IN1 IL3 OH1 DC1 KS1 CA2 CA1 MO1 NC1 GA3 GA2 TX2 TX5 GA1 TX3 TX1 TX4 Figure 15. North American Network