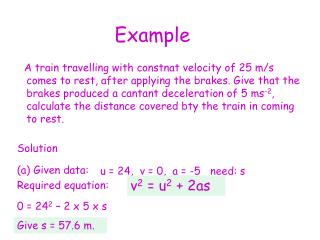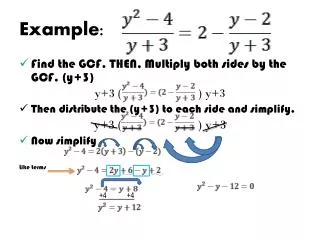
Example :
Working With DATA … ( Unit 12 ) Student Outcome: I will learn and solve problems using central tendency’s. Before you can find the median, mode, mean, range or outliers you must always ORDER your data in correct order from lowest to highest of numbers

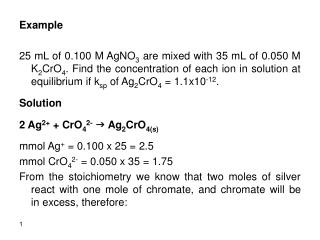
Example :
E N D
Presentation Transcript
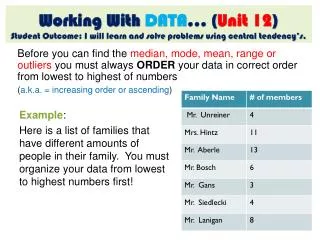
Working With DATA… (Unit 12)Student Outcome: I will learn and solve problems using central tendency’s. Before you can find the median, mode, mean, range or outliers you must always ORDER your data in correct order from lowest to highest of numbers (a.k.a. = increasing order or ascending) Example: Here is a list of families that have different amounts of people in their family. You must organize your data from lowest to highest numbers first!
12.1 Place the numbers in order…Student Outcome: I will learn and solve problems using central tendency’s. Raw Data6 4113 8 134 Ordered Data3 4 4 6 8 11 13 Measure of Central Tendency: The value that represents the centre of a set of data… • Median: the middle number of the data = ___________ • Mode: the number that occurs the most = ___________ • Mean: the average of all the numbers…add all the numbers and then divide them by the amount of numbers = __________
12.1 Try it again…(Median)Student Outcome: I will be able to determine the median of a data. Raw Data4 8 6 2 9 4 11 7 Ordered Data Increasing order is called: • The median is = _______ • The modeis = _______ • The meanis = _______ What is the mode (most often)?
12.1 Try it again…(Median)Student Outcome: I will be able to determine the median of a data. Raw Data8 9 5 7 2 5 4 11 Remember…place them into increasing order first! Then find the middle number. Ordered Data • The median is = _______ • The modeis = _______ • The meanis = _______ • RULE: for finding the median. Can you come up with one? • Odd #’s: • Even #’s: What is the mode (most often)?
12.1 TRICKY QUESTION…Student Outcome: I will be able to determine the median of a data. The total number of T-shirts sold are 6 + 7 + 5 + 4 + 4 = 26 PROBLEM: Find the median, mode and mean price for the total number of shirts sold! You may work with a partner. • The median is = _______ • The modeis = _______ • The meanis = _______ What is the mode (most often)?
Median (Ordered data) 8,8,8,8,8,814,14,14,14,14,14,14,17,17,17,17,17,20,20,20,20,25,25,25,25 • Mode: • Mean = 411 ÷ 26 = 15.8
12.1 TRY ANOTHER ONE…Student Outcome: I will be able to determine the median of a data. The total number coffees sold. 12 10 9 5 = _____ PROBLEM: Find the median, mode, mean price for the number of coffees sold. • The median is = _______ • The modeis = _______ • The meanis = _______
Median (Ordered data) 2,2,2,2,2,2,2,2,2,2,2,2,3,3,3,3,3,3,3,3,3,3,3.5, 3.5,3.5,3.5,3.5,3.5,3.5,3.5,3.5,4,4,4,4,4 • Mode: • Mean = 105.5÷ 36= 2.9
12.1 TRY ANOTHER ONE… Learn Alberta – mode, median http://www.learnalberta.ca/content/memg/index.html?term=Division03/Mode/index.html
Example #1 • The data below are the yearly wages (in dollars) of ten people working at an on-line music store. • DATA: { 41 000, 41 000, 41 000, 41 000, 43 000, 45 000, 48 000, 50 000, 50 000, 250 000 } • What is the: • Mean • Median • Mode • Based on the data what “inferences” can you make?
Example #2 • The data below are the seventeen shoe sizes of one type of shoe sold in one day at a local shoe store. DATA: { 5, 6, 7, 7, 7, 7, 7, 7, 8, 9, 9, 10, 11, 12, 13, 13, 15 } • What is the: • Mean • Median • Mode • Based on the data what “inferences” can you make?
12.1Practice makes Perfect! Page 426: # 4, 6, 7 Page 427: # 10, 11, Extend #13, 14a, 17 SHOW YOUR WORK!!!
12.2 Finding the “MEAN”Student Outcome: I will be able to determine the mean of a data. • Mean: • the sum of a set of values divided by the number of values in the set. • Example: • 4 5 9 11 6 8 • Mean = 4 + 5 + 9 + 11 + 6 + 7 = • 6
12.2 Finding the “MEAN”Student Outcome: I will be able to determine the mean of a data. • Find the mean to the values in the sets below. • 12 14 8 6 23 • Mean = ______ • 4 6 7 8 3 6 2 1 • Mean = ______
12.2 Calculate the mean of sales!Student Outcome: I will be able to determine the mean of a data. • What is the daily mean number of sales from Monday to Saturday? • Are there any days that the stores has sales below the mean?
12.2Tricky Question…Student Outcome: I will be able to solve problems using the mean. • Let’s say the daily mean of sales was 100 for 7 days (a full week). • How many chips would you need to sell on Sunday? • How do you solve this?
12.2 Use the mean to “PREDICT” Student Outcome: I will be able to solve problems using the mean. • A scientist recorded the daily distance travelled by a spawning salmon for five days. • Find the mean…
12.2 Use the mean to “PREDICT”Student Outcome: I will be able to solve problems using the mean. • Now that you know the average (mean) distance travelled is 50km…find some predictions. • Predictions: • Predict how many kilometres the salmon will travel on Saturday? • Predict how many kilometres the salmon will travel over… • 8 days? • 12 days? • A Chinook Salmon may travel 8000km from its feeding grounds in the North Pacific Ocean. Use your mean to find out how many days it will take for this fish to travel.
12.2 TRY ANOTHER ONE… Learn Alberta – mean http://www.learnalberta.ca/content/memg/index.html?term=Division03/Mode/index.html
12.2Practice makes Perfect! Page 431: # 3, 5, 7 Page 432: # 8,10, 14 SHOW YOUR WORK!!!
12.3Range&Outliers…Student Outcome: I will determine the range and outliers from sets of data. • Range: • The positive difference between the largest & smallest values in a set of data. • Example: • 4 5 9 11 6 8 13 22 5 • Range • Median • Mode • Mean
12.3Range&Outliers…Student Outcome: I will determine the range and outliers from sets of data. • Outliers: • A value that is MUCH smaller or larger than the other data values…might be one or more or none! • Example: • 3 10 67 8 5 9 4 7 11 • Outliers • Range In your own words explain how you can determine whether there is an outlier in a set of data
12.3Identify Outliers to find a “New Range”Student Outcome: I will determine the range and outliers from sets of data. • Top NHL Scorer • Find the ranges for both seasons? How do they compare?
12.3Identify Outliers to find a “New Range” Student Outcome: I will determine the range and outliers from sets of data. • Top NHL Scorer • Find the ranges for both seasons? How do they compare? 1985-86 = 92and 2005-06 = 22 • Which data value appears to be an outlier in one of the two seasons?
12.3Identify Outliers to find a “New Range”Student Outcome: I will determine the range and outliers from sets of data. • Top NHL Scorer • Find the ranges for both seasons? How do they compare? 1985-86 = 92and 2005-06 = 22 • Which data value appears to be an outlier in one of the two seasons? 1985-86 Season • Remove the outlier and determine the new range. Now, how do the two season ranges compare?
12.3 TRY ANOTHER ONE… Learn Alberta – mean http://www.learnalberta.ca/content/memg/index.html?term=Division03/Mode/index.html
12.3Practice makes Perfect! Page 437: # 3, 5, 7, 8 Page 438: # 9, 12, 15 Page 439: # 16 (work with a partner on this one…good luck) SHOW YOUR WORK!!!
12.4The Effects of Outliers!Student Outcome: I can identify/explain effects of outliers for sets of data. Be able to “justify” whether outliers should be included when determining measures of tendency (mean, mode, median & range). Example: In a science class students were asked to take home a bean seed and to bring it back in two weeks. Below are the growth (height) results. • Is there and outlier and if so why should it be taken out of the class results? Give an explanation of what may have happened. • Then find the measures of central tendencies.
12.4The Effects of Outliers!Student Outcome: I can identify/explain effects of outliers for sets of data. • 1. Is there and outlier and if so why should it be taken out of the class results? Yes there is an outlier… • Student may have measured in mm instead of cm. • Evan works at a greenhouse and placed steroids in the soil. • …share others! • 2. Then find the measures of central tendencies. • Mode: there are none! Range: 3.2 – 2.4 = +0.8 • Mean: 16.9/ 6= 2.8 Median: 3.2 2.7 3.12.8 2.7 2.4 • 3.1 + 2.8 = 5.9/2 = 2.95
12.3 TRY ANOTHER ONE… Learn Alberta – central tendancy’s http://www.learnalberta.ca/chttp://www.explorelearning.com/index.cfm?method=cExtAccessSecure.dspResource&ResourceID=1018&certificate=authorizer%3DLearnAlberta%26userid%3DLA38%26i%3D0%26expires%3D2011%252F05%252F31%2B14%253A52%253A53%26hash%3DuzBIC8kuNGpWU9NPn%252Bj3iw%253D%253Dontent/memg/index.html?term=Division03/Mode/index.html
12.4Practice makes Perfect! Page 444: # 3, 5 Page 445: # 7 SHOW YOUR WORK!!!
12.5 “BEST” measure of central tendencyStudent Outcome: I will be able to solve problems using various types of central tendency’s • How do you know when to use the mean, mode, median or range? • Taylor kept track of her quizzes for the week (4, 5, 8, 9, 9)… Median = 8 Mode = 9 Mean = 7 Which central tendency best describes her quiz results for the week?
12.5 Choose the “BEST” measure of central tendency • How do you know when to use the mean, mode, median or range? • 1. What are the mean, median, mode and range? • Mean: • Mode: • Median: • 2. Compare the mean, median and mode. Which measure seems to best represent the ten numbers? Explain.
12.5 “BEST” measure of central tendencyStudent Outcome: I will be able to solve problems using various types of central tendency’s • How do you know when to use the mean, mode, median or range? • 1. What are the mean, median, mode and range? • Mean: 137/10 = 13.7 which is rounded to “14 sales.” • Mode: 7,7,7,8,9,9,10,11,12,50 = 7 is the most often • Median: 7,7,7,8,9,9,10,11,12,50 = 9…both the same #. • 2. Compare the mean, median and mode. Which measure seems to best represent the ten numbers? Explain.
12.5 “BEST” measure of central tendencyStudent Outcome: I will be able to solve problems using various types of central tendency’s • How do you know when to use the mean, mode, median or range? • 3. Share your answers with a classmate. Do you agree…if not, explain the reasons for your selection. • Mean: 14 Median: 9 Mode: 7 • 4. How many T-shirts should be purchased for the next 30 weeks? Explain.
12.5Practice makes Perfect! Page 449: # 3 Page 450: # 4, 6, 9 SHOW YOUR WORK!!!
Chapter “9-12” Review Page 458-460 #1-22 SHOW YOUR WORK!!!
Challenge In Real Life! – Page 457 • This is a summary assignment where you will create a poster that indicates your investigation into size, brand and price of shoes for clients of your own age. Show ALL YOUR WORK! • Things to do… • What sizes to order (ages 12-14)? • What brand names to order? • How much are teenagers willing to pay?
Your own “Shoe Store” • What sizes to order??? • Ask 20 friends/family…
Your own “Shoe Store” • What brand to order??? • Ask the same 20 friends/family… • Think of at least 10 different brands
Your own “Shoe Store” • What price are they willing to pay??? • Ask the same 20 friends/family… • Make sure to use the prices of the shoes mentioned…but don’t let them know which shoes cost which price!
Analyze Your Data… • Analyze your data to help you decide what you need to order. Include measure of central tendency for all three charts…make sure to take remove outliers…but make sure to mention them in your work! • Summarize all three charts and explain which measure of central tendency is best for each. Be sure to explain your choices. • You have 1 week to complete.