Download
1 / 49
490 likes | 619 Views
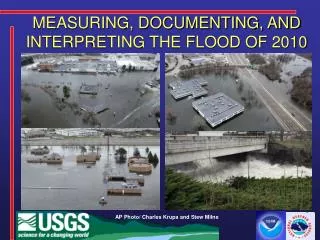
MEASURING, DOCUMENTING, AND INTERPRETING THE FLOOD OF 2010. AP Photo/ Charles Krupa and Stew Milne. PRESENTATION OVERVIEW. Long-term USGS hydrologic network Streamflow measurements during the flood Stage-discharge rating curve extension and changes

E N D
MEASURING, DOCUMENTING, AND INTERPRETING THE FLOOD OF 2010 AP Photo/ Charles Krupa and Stew Milne
PRESENTATION OVERVIEW • Long-term USGS hydrologic network • Streamflow measurements during the flood • Stage-discharge rating curve extension and changes • USGS, NWS, and other agencies cooperation during the flood • Probability of exceedance of the flood • USGS, FEMA, RIEMA, and ACOE and other agencies cooperation after the flood • Identification of high-water marks • Surveying high-water marks • Where do we go from here – other studies
PRECIPITATION MARCH 13-15, 2010 Data Courtesy of NWS-Taunton
PRECIPITATION MARCH 22-23, 2010 Data Courtesy of NWS-Taunton
PRECIPITATION MARCH 29-30, 2010 March 29th-30th, 2010 Data Courtesy of NWS-Taunton
TOTAL PRECIPITATIONLATE FEB. – EARLY APRIL 2010 Data Courtesy of NWS-Taunton
PAWTUXET RIVER AT CRANSTON • Discharge (Ref: BT) Left to Right Nmb. of Ens. 411 • Start Time09:13:30 Duration 153.75 [s] • Top Q 963.10 [ft³/s] Measured Q 5771.38 [ft³/s] • Bottom Q 1050.74 [ft³/s] (T+M+B) Q 7785.22 [ft³/s] • Total Q 8978.00 [ft³/s]
PAWTUXET RIVER AT CRANSTON Previous max. GH = 14.50 ft (June 7, 1982) for 70 years GH=14.98 ft GH=20.79 ft
PAWTUXET RIVER AT CRANSTON Previous max. Q = 5,440 cfs (June 7, 1982) for 70 years Q=5,380 cfs Q=14,100 cfs
DURING THE FLOODS • 21 of the 27 network streamgages had the highest discharge measurement made in the period of record • 16 stage-discharge rating were extended during the floods to assist the NWS – Advanced Hydrologic Prediction Service (AHPS)
STAGE-DISCHARGE RATING CHANGES Rating 42 was prior to the March 30-31 flood with a max. GH = 15.00 ft and Q = 5,200 cfs Rating 42.1 extended to max. GH = 20.00 ft and Q = 9,600 cfs during the flood Rating 43 new – revised with Q measurements during flood with a max. GH = 22.00 ft and Q = 17,200 cfs Note: new Rating 43 had to be extend to a GH of 22 ft, which 7 ft higher than previous ratings.
STAGE-DISCHARGE RATING CHANGES Rating 27 was prior to the March 30-31 flood with a max. GH = 11.00 ft and Q = 2,700 cfs Rating 27.1 extended to max. GH = 16.00 ft and Q = 5,100 cfs during the flood Rating 28 new – revised with Q measurements during flood with a max. GH = 14.00 ft and Q = 5,700 cfs Note: with new Rating 28 at a GH = 11.00 ft – the Q = 3,530 cfs about a 31% increase in Q
S. BRANCH PAWTUXET R. AT WASHINGTON Previous max. Q = 1,980 cfs (June 6, 1982) for 69 years Q=2,060 cfs Q=5,280 cfs
PAWCATUCK RIVERAT WOOD RIVER JUNCTION Previous max. Q = 1,860 cfs (June 7, 1982) for 69 years Q=3,580 cfs
WOOD RIVER AT HOPE VALLEY Previous max. Q = 2,390 cfs (June 6, 1982) for 69 years Q=5,470 cfs
DURING THE FLOODS • Equipment at 1 streamgage (Big River at Rt. 3) was damaged and 1 streamgage (Congdon River) structure and equipment was lost when the bridge washed out • Assistance from the CT and NH-VT WSCs
DURING THE FLOODS • Equipment at 1 streamgage (Big River at Rt. 3) was damaged and 1 streamgage (Congdon River) structure and equipment was lost when the bridge washed out
DURING THE FLOODS Gage re-started At new location 300 ft upstream At new control Q meas. made 3/30 at 16:45 Data stopped 3/30 at 20:15
NEW PEAKS OF RECORD • 17 of the 21 streamgages with at least 10 years of record had a new peak of record • 11 of the 15 streamgages with new peaks of record have from 30-70 years of record (8 of 8 in Pawcatuck River Basin and 2 of 2 in the Pawtuxet River Basin)
FREQUENCY • “The flood is considered to be anywhere between a 100 and 500 year flood… that means for the people here this is a once in a lifetime disaster”(Elysia Rodriguez, WWLP.com 22 News - http://www.wwlp.com/dpp/news/worst-flooding-in-ri-in-100-years) • “We had two 100-year floods in two weeks,” Capone, Taunton NWS said. “This will be much higher than a 100-year flood” (http://www.usatoday.com/weather/floods/2010-03-31-flood_N.htm)
RECURRENCE INTERVALS * STREAMFLOWS EFFECTED BY REGULATED
USGS HYDROLOGIC NOTIFICATION SERVICE • New USGS Hydrologic Notification Service (HNS) sends e-mail or test messages for user defined thresholds of real-time data • Surface water • Groundwater • Water quality • Precipitation • http://water.usgs.gov/rt-hns/
NEW STREAMGAGES ? • Pawtuxet River at Fiskville (outflow of Scituate Reservoir) ? • Pocasset River at Rt. 2 ? • Eastern RI – Adamsville Brook ? • Reservoir elevation gages for Scituate and Flat River Reservoirs ?
QUESTIONS • USGS Information • http://water.usgs.gov/ • http://ri.water.usgs.gov/ • http://water.usgs.gov/rt-hns/ • USGS Contacts • Phil Zarriello (MA-RI WSC) • pzarriel@usgs.gov • (508) 490-5010 • Gardner Bent (MA-RI WSC) • gbent@usgs.gov • (508) 490-5041
USGS-FEMA-RIEMA CHARTERIZING THE FLOOD • HWM Identification • Survey HWMs into NAVD88 • Calculate flood frequency at gages ? • Calculate flow at ungaged sites using indirect methods ? • Develop regression equations for estimating flood frequency at ungaged sites ? • Compare HWM elevations to flood profiles and new flood frequencies with existing Flood Insurance Studies ?
IDENTIFICATION OF HWMs • PHOTOS
IDENTIFICATION OF HWMs • PHOTOS
FLAGGING HWMs – USGS and USACE • Blackstone River Basin • Mainstem Blackstone from Pawtucket to Woonsocket USACE • Branch River to headwaters USACE • Moshassuck River BasinUSACE • Pawcatuck River Basin • Mainstem Pawcatuck from Westerly to Worden Pond USGS • Ashaway River to CT border USGS • Wood River to Rt. 165 USACE • Tomaquag River USGS • Meadow Brook USACE • Beaver River USACE • Usquepaug-Queen River USGS • Chipuxet River USGS • Pawtuxet River Basin • N. Branch Pawtuxet to Scituate Res. to headwaters USGS • Mainstem from North and South Branch to Cranston USGS • Mainstem from Cranston streamgage to mouth USACE • S. Branch Pawtuxet to Flat River Res. to headwaters USACE • Pocasset River USGS • Woonasquatucket River BasinUSGS
SITE MAP HWMs • MAP
HWM DATABASE • Over five days from April 2-7 about 274 HWMs were identified at about 134 sites by USGS • USACE during same period had about 175 HWMs identified at about 90 sites
FLOOD FREQUENCY STUDY ? • Johnson, C.G., and Laraway, G.A., 1976, Flood magnitude and frequency of small Rhode Island streams: U.S. Geological Survey Open-File Report 76-883, 22 p. • The regression equations developed are for estimating peak discharges with recurrence intervals of 2 and 5 years • The 10-, 25-, and 50-year floods are computed as ratios of the 2-year peak discharge • The regression equations were developed from peak-discharge records from 1966-1971 for 38 stations and are applicable only to rural streams having no significant storage with drainage areas less than 10 square miles
RI FLOOD 2010 STUDY ? • Flood profiles ? • Frequency analyses of HWM sites ? • Comparison to existing Flood Insurance Studies ?
Sources: projo.com; wunderground.com; dot.ri.gov; abc6.com • Providence Journa/Kris Craig Warwick Waste Water Treatment Facility
S. BRANCH PAWTUXET R. AT WASHINGTON Previous max. GH = 5.30 ft (June 6, 1982) for 69 years GH=9.22 ft GH=5.42 ft
Schutt and Cranston Mayor Allan Fung surveyed the flood from a helicopter. "From the sky, you can see how far the Pawtuxet exceeded its banks," Schutt said. "It's now in those areas (the Federal Emergency Management Agency) designated as a one-in-500-years flood event." • The river at Cranston crested Wednesday at 20.7 feet. Flood stage is 9 feet, according to the National Weather Service. Rivers in Connecticut, Massachusetts and New Hampshire will crest through the weekend, said Ed Capone, service coordination hydrologist at the Northeast River Forecast Center. • Flooding elsewhere is forecast to cover roads and inundate some buildings, but around Cranston, Warwick and West Warwick, the flooding is unprecedented, Capone said. • The river gauge at Cranston registered a flow of 14,000 cubic feet per second Tuesday night, compared with the last record flood two weeks ago of 5,000 cubic feet per second, he said. Normal is 750 to 1,000 cubic feet per second. • "We had two 100-year floods in two weeks," Capone said. "This will be much higher than a 100-year flood.“ • (http://www.usatoday.com/weather/floods/2010-03-31-flood_N.htm)