Download
1 / 35
380 likes | 451 Views
Measuring and interpreting microbiome. Carolina Medina-Gomez Department of Internal Medicine, ErasmusMC 45th Congress of the European Calcified Tissue Society May 27th, 2018. Outline of the Presentation. Brief Introduction Phylogenetic resolution Analysis of grouped data

E N D
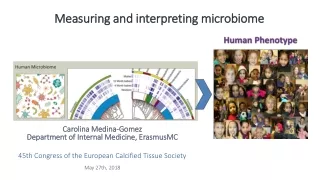
Measuring and interpreting microbiome Carolina Medina-Gomez Department of Internal Medicine, ErasmusMC 45th Congress of the European Calcified Tissue Society May 27th, 2018
Outline of the Presentation • Brief Introduction • Phylogenetic resolution • Analysis of grouped data • Reverse causal reasoning • The right transformation
Humans as Holobionts • Gut microbiota influences the immune system, energy biogenesis, biosynthesis of vitamins and hormones, and our metabolism. Diseases as diabetes, Cohn’s disease, ulcerative colitis and multiple sclerosis are associated with gut microbiome. • The gut microbiomeprovidesanattractive target fortherapeuticintervention.
Humans as Holobionts Stool samples: adequate representation of gut content *Sender et al. PLOS Biology. Aug.2016
Biogeography of the intestine *Perera and Berry et al. Environmental Microbiology. 2017
Comparison metagenomics VS. 16SrRNA METAGENOMICS METAGENOMICS 16SrRNA SEQUENCING Bacterial Genome Genome fragments Genome fragments Alignments of sequences Alignments of sequences Amplicon library Entire communities (viruses and fungi) Only bacteria and Archaea Relatively expensive Relatively cheap – large sample sizes Highly variability, higher resolution Taxonomic classification to Genus level? Direct assessment of genes and pathways Genes and pathways based on classification Entire communities (viruses and fungi) Only bacteria and Archaea Relatively expensive Relatively cheap – large sample sizes Highly variability, higher resolution Taxonomic classification to Genus level? Direct assessment of genes and pathways Genes and pathways based on classification
16SrRNA R packages dada2, phyloseq, DESeq2 MaAsLin
Enterococcus sp. Phylogenetic tree Enterococcus faecium 2004: 28 sp 2018: 52 sp. J. Clin. Microbiol. 2004. 42 (3): 1192-1198 Braz. J. Biol. 2015. 75 (4)
Taxonomic Classification of Bacterial Sequences NEXTflex V4 16S amplicon Nextera XT Jovel at al. 2016. Frontiers of Microbiology
Segre J. The rise of whole genome microbial sequencing: A new era for human microbiome analysis Originally aired: Wednesday, October 4, 2017
OTU vs. Taxonomy Classification Analysis • Several OTUs can be assigned to the same genus • Depending on my research question I can decide type of analysis (also consider FDR adj). (What does it mean ChristensenellaceaeR7group?) • We aggregated the data at different taxonomy classifications (excluding OTUs with < 0.8 Score at each different level). • OUT_315 wont be included in the ChristensenellaceaeR7group Genus aggregation , nor in the Christensenellaceae Family aggregation.
? Boulange, Genome Medicine 2016
MaAsLin: Multivariate Association with Linear Models OTU ~ trait/disease https://huttenhower.sph.harvard.edu/maaslin-- Department of Biostatistics, Harvard T.H. Chan School of Public Health
Relative Abundances– Arcsine transformation Not perfectly normal but much better ArcSin transformation is default to MaAslin but you have an option to change this default transformation
Relative Abundances– Arcsine transformation Zero inflated models!
Y= Trait or disease X= Microbiome species confounders
Compositional data Gloor et al. 2017. Frontiers of Microbiology
The additive log-ratio transformation Aitchison’s work
Takehome messages! • As no “gold standard” methods are still available yet for the analysis of microbiome, there is a lot of flexibility in the methods to be used. However, you need to be conscious of the pros/contras of this decision. • New methodologies will surely emerge as, in other fields, the advances to acquire more and better data are going faster than the development of analysis algorithms. Therefore, in such an emergent field you need to update yourself constantly to keep in the cutting-edge loop
Different variableregions of 16S rRNAsequencing * https://chunlab.wordpress.com/16s-rrna-and-16s-rrna-gene/