Download
1 / 38
380 likes | 471 Views
Learn how matching data sources enhances STD surveillance, detects comorbidities, and supports collaboration. Discover matching algorithms, technical considerations, and successful case examples. Explore the benefits of coordinating vital statistics, behavioral data, and other related information.

E N D
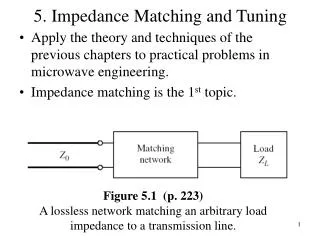
Enhancing STD Surveillance by Matching to Other Data Sources: A Hot Topic Michael C. Samuel, DrPH California Department of Health Services Lori Newman, MD Centers for Disease Control and Prevention
Defining Matching • Case-based • Matching individually line-listed data to another individually line-listed source of data • Ecologic • Correlate stratum-specific (e.g. county level) rates of one disease or condition with rates of another
Why Match? • Assess co-morbidity or the co-occurrence of diseases/conditions –> identify “hot spots” • Answer specific research questions • Complete missing data or correct data • Case finding • Analyze patterns of re-infection
Why Match? • Encourage collaboration and communication between programs • “Mining” existing data • Prioritize program activities / target limited resources
Diseases Syphilis Gonorrhea Chlamydia NGU Herpes AIDS/HIV Cancer TB Enterics Vital Statistics Births Deaths Other related data Substance use Tx Incarceration Records Behavioral Data e.g., BRFS SES, etc. Data e.g., Census Data Sources
Technical Issues • Confidentiality/Security • Data formats • Software • SAS, Access, etc. • Dataflux (and other matching software) • STD*MIS and HARS • NEDSS
Matching Criteria • Unique identifiers • Algorithms • Incorrect matches (false positive) • Missed matches (false negative) • Database size
STDs and HIV/AIDS Co-morbidity and STDs as markers of HIV risk Chlamydia Gonorrhea Syphilis HIV
California Matching Algorithms • Match 1 (Automated Exact Match) • Exact matches on: Last Name, First Name, DOB • Match 2 (“Best” Match) • Exact matches + manually reviewed matches with point values ≥ 35 • Match 3 (Loosest Match) • “Best” match + HARS records with no names that match STD records on SOUNDEX, DOB, SEX
Variable Name Description Points FIRST First 3 letters of first name 15 ALLNAME All letters in first and last names match 10 MONTH Month of birth date 10 DAY Day of birth date 5 YEAR Year of birth date within 5 years 15 IDENTICALYEAR Year matches identically 5 MDY Month, day, year of birth date all match 10 TRANSPOSITION Month and day are transposed 15 Point System *All matches with a total point value ≥ 35 were manually reviewed by two individuals to determine match validity
Matching Algorithm Syphilis-AIDS Cases 1990-2001 Exact Match 150 "Best" Match 184 Loosest Match 244 Co-morbidity from Three Matches
Percent of Male Syphilis Cases with AIDS Diagnosis Percent with AIDS Diagnosis California Department of Health Services, Office of AIDS. Epidemiological Studies Section
Washington State - HIV Prevalence Among Infectious* Syphilis Cases, 1994 - 2002 Number of Cases Percent HIV+ 100 60 All Infectious Syphilis Cases t Percent HIV+ t 50 80 40 t 60 t t t 30 40 20 20 10 t t t t 0 0 1994 1995 1996 1997 1998 1999 2000 2001 2002 Year *Primary, secondary and early latent syphilis
Washington State - HIV Prevalence Among Reported Chlamydia Cases, 1994 - 2002
Trend in Rate of Change, Reported STDs*, PLWHA and STDs Reported Among PLWHA 1998 - 2002 Percentage Increase 35 l t PLWHA 30 l STDs Among HIV+ 25 s All STD Cases l 20 l 15 t s t 10 t t s s s 5 l 0 98-99 99-00 00-01 01-02 Interval *Chlamydia, gonorrhea, P, S & EL syphilis only
Detroit HIV/STD Match • 1997-2004 • 2.8% to 4.9% (per year) of syphilis cases co-infected with HIV • 67% of these were infected with syphilis after HIV diagnosis
California Chlamydia/Birth Match • Assess adverse birth outcomes associated with chlamydia (CT) during pregnancy • 1997-1999; 675,000 births, 101,000 female CT cases • 14,000 matched cases with CT during pregnancy
CA Chlamydia/Birth MatchResults Low birth weight (LBW): • 6.6% LBW among women with CT • 4.7% LBW among women without CT • Adjusted (for age, race, education, prenatal care) Odds Ratio = 1.2 (95% CI 1.1-1.3)
California “Family PACT” Administrative / Unilab Chlamydia Test Data, 2000
Unilab and FPACT Claims Data :Female CT Positivity By Age and Race/ Ethnicity Dec00-Jul01
Family PACT Match Results/Conclusions • Precise estimates of age/race specific chlamydia prevalence rates • Demonstrates racial disparities in CT rates from large state “safety net” provider, not otherwise available • Required no additional data collection
Virginia HIV/AIDS Case Finding • TB match with HIV/AIDS found few new cases, but helped complete risk factor data (IDU) • ADAP (AIDS Drug Assistance Program) match with HIV/AIDS identified many new cases and improved timeliness of reporting
California – Repeat Gonorrhea Infection Assessment • Exact match on name and date of birth • 1/1/2001-12/31/2002 • >26,000 unique cases • >1,650 (6%) re-infections or duplicates
Patients with Two or More Gonorrhea Infections*California Project Area, 2001–2002 Duplicate? Treatment Failure? True Re-infections? * Repeat infections identifier based on patient last name and date of birth.
OASIS Matching Findings • Substantial and increasing STD cases after HIV/AIDS; highlights potential for HIV transmission (CA, SF, WA, MA…) • Lack of chlamydia / HIV co-morbidity screening of CT cases for HIV not resource efficient (WA) • Little TB / STD co-morbidity (multiple sites) • Successful for building data mart across diseases (NY)
Strengths of Matching • Inexpensive, efficient way to augment knowledge • Can be made easy/simple • Automated matches • Data warehouses • NEDSS-like systems • Can help build bridges • Can provide actionable results • Interpret carefully • Even negative match can provide info
Weakness/Limitations of Matching • Technically may be difficult or impossible • No unique identifiers • Database/registry may cover small and/or biased population • Can be time consuming and difficult • May be better ways to get data • e.g., ask cases with one disease if they have another • Confidentiality concerns • May not provide information for action
General Recommendations • Know data sources • Assure data protection • Assess technical capacity and technical issues before beginning • Assess likely “juice for squeeze” • Collaborate with OASIS team • Think ……………………….…..outside the box
STD Control Branch Joan Chow Denise Gilson Mi-Suk Kang Office of AIDS Maya Tholandi Allison Ellman Juan Ruiz Thanks to the California Matching Team And, • Kathryn Macomber, Michigan Department of Health • Mark Stenger, Washington State Department of Health • Jeff Stover, Virginia Department of Health
For more information contact:Michael C. Samuelmsamuel@dhs.ca.gov510-540-2311orLori Newmanlen4@cdc.ogv404-639-6183
Timing of Syphilis-AIDS Diagnoses (1999-2001, “Best” Match) California Department of Health Services, Office of AIDS. Epidemiological Studies Section
Scatter plot of Gonorrhea and Chlamydia Rates by Gender and State, United States 2002