Download
1 / 25
250 likes | 387 Views
This section explores vital concepts of population dynamics, including definitions of population, population density, and dispersion patterns. It discusses how populations grow through intrinsic rates and external factors, illustrated by real-world examples such as exponential and logistic growth models. Key terms such as carrying capacity, density-dependent and independent factors are defined, highlighting their roles in regulating population sizes. The chapter also examines practical applications of these principles, offering a comprehensive understanding of how species thrive in varying environments.

E N D
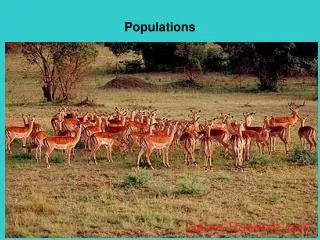
Population Dynamics Population: a group of a particular species that uses the same resources and successfully interbreed Population Density: # of individuals within a particular area
Population Dispersion How are populations spread out?
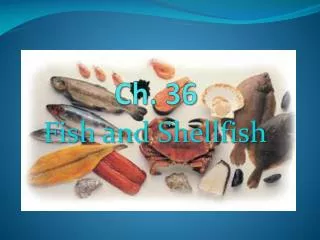
Clumped Pattern What pattern of dispersion would you expect a predator of this fish population to have?
What Factors Influence Growth? G = rN G = growth r = instrinsic rate of increase N = population size
Growth Rate Examples • US = 2.1% • Kenya = 3.9%
G = rN If r is constant, growth rate would depend only on N The larger the N, the faster the population growth
Exponential Growth (J curve) The larger the N, the faster the growth rate
Exponential Growth (J curve) 500 450 400 350 Fig. 36-4a 300 Population size (N) 250 200 150 100 50 0 0 10 4 8 9 2 3 5 6 7 11 12 1 Time (months)
Logistic Growth (S curve) G = rN (K-N)/K Limited by K (carrying capacity) Carrying capacity= maximum # individuals an ecosystem can hold
Logistic Growth (S curve) 10 8 Fig. 36-4bb Breeding male fur seals (thousands) 6 4 2 0 1915 1945 1925 1935 Year
Try these….. • G = rN (K-N)/K When N is small in comparison to K, growth rate is high Ex: N = 1000 K = 10,000 r = 2
When N is large in comparison to K, growth rate slows • Ex: N = 9000 K = 10,000 r = 2
When N is larger than K, the growth rate is negative If population size is 12,000 and K is 10,000 and r is 2…..
Other factors that affect logistic growth? • Ecological limits • Age distribution • Immigration/emmigration • Predation
Density Dependent Limiting Factors They regulate growth rate depending on the number of species within the population: Ex: Shelter, Food, Water, Competition for mates
Density Independent Factors • They regulate growth rate and do not depend on the number of species within the population • Ex. Fire, Drought
Boom Bust Cycle Snowshoe hare 160 120 9 Lynx Hare population size (thousands) Lynx population size (thousands) 80 6 40 3 0 0 1850 1875 1900 1925 Year