Investigating the Reaction of Calcium Carbonate Ores with Hydrochloric Acid
This study explores the reaction dynamics of calcium carbonate ores with hydrochloric acid through a series of case studies. Students measured fizzing duration, mass changes before and after reactions, and the volume of CO2 gas produced. The aim is to identify patterns in ore reactivity across different concentrations and conditions. Furthermore, considerations regarding reproducibility and the identification of optimal quarry locations for mining calcium carbonate are discussed, based on experimental data. Insights drawn from the pooled results will inform mining strategies.

Investigating the Reaction of Calcium Carbonate Ores with Hydrochloric Acid
E N D
Presentation Transcript
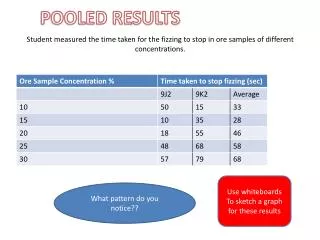
POOLED RESULTS Student measured the time taken for the fizzing to stop in ore samples of different concentrations. Use whiteboards To sketch a graph for these results What pattern do you notice??
Case study 1 Student measured the time taken for the fizzing to stop in ore samples of different concentrations. Use whiteboards To sketch a graph for these results What pattern do you notice??
Case study 2 Students added Hydrochloric Acid to different samples of calcium carbonate ores. They measured the mass before the reaction and the mass after the reaction, they calculated how much mass was lost. Use whiteboards To sketch a graph for these results What pattern do you notice??
Case study 3 A group of University students added Hydrochloric Acid to different samples of carbonate ores. They measured volume of Carbon dioxide Gas produced in one minute Use whiteboards To sketch a graph for these results What pattern do you notice??
Case study 4 Scientists working in Europe wanted to check which areas were best suited to building a quarry to mine Calcium Carbonate Ores. The 6 areas are labelled on the diagram. (A-F) A B E D C F Kg Mass of Calcium Carbonate found per 100 tonnes Mass of Calcium Carbonate needed for quarrying to be effective Quarry Area of Europe
Section 2 Mock 1.List the variables for your investigation: a)Independent b)Dependent c)Control. (3marks) 2.Explain why you did or did not repeat your results? (3marks) 3. Describe one uncertainty in your results. Explain how you could reduce errors and uncertainty in your investigation. (3marks) 4. Do your results support your hypothesis? Explain the pattern and refer to data from your results. (3marks) 5. Looking at the results from the Pooled results sheet explain whether you think the results from the other classes show that this investigation is reproducible? Use examples from your results and the results from the other class. (3marks) 6. Draw a sketch Graph of the results from Case study 1 (2marks) 7. Look at case studies 1,2 and 3. Do the results support your investigation hypothesis? Give examples from the case studies. (3marks) 8. Look at case study 4. The miners want to find the best place to quarry calcium ore. Which is the best place to quarry and why? What other tests could the miners scientist do to find the best place to quarry? (3marks) 9. How could your results be helpful for a mining company? (3marks)