Understanding Boston Temperature Data with Two-Box Example
Explore a coded example of heavy boxes and temperature graphs in Boston using JIProlog. Understand Cartesian data plots and temperature models.

Understanding Boston Temperature Data with Two-Box Example
E N D
Presentation Transcript
Diagram Understanding by Victor Dubinsky
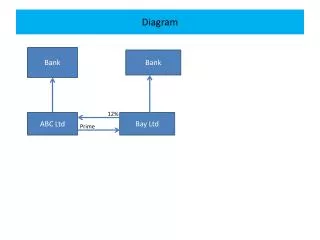
Two-box Example Figure 1. The box on the right is heavy.
JIProlog - Java Internet Prolog JIPExtend jipe = new JIPExtend(); JIPEngine engine = jipe.engine; engine.consultFile("2DCartisianDataPlot.pl");
Two-box Example Figure 1. The box on the right is heavy.
Coded Two-box Example jipe.addTerm("box(a)."); jipe.addTerm("small(a)."); jipe.addTerm("box(b)."); jipe.addTerm("large(b)."); jipe.addTerm("left(a)."); jipe.addTerm("right(b)."); jipe.addTerm("heavy(X):- box(X),large(X).");
/* is_A(X,time) defines several relationships, /* saying that they are of type time. is_A(seconds,time). is_A(minutes,time). is_A(hours,time). is_A(days,time). is_A(weeks,time). is_A(months,time). is_A(quarters,time). is_A(years,time). is_A(decades,time). is_A(centuries,time). /* temperature. is_A(f,temperature). is_A(c,temperature). /* distance. is_A(km,distance) /* Two Dimentional Cartesian Data Plot. is_A(xyPlot,twoDCartesianDataPlot). /* Definition of type_Of(X,Y) relationship. type_Of(X,Y):-is_A(X,Y). /* Definition of a generic temperature graph. temperatureGraph(A):-graph(A),graphType(A,X), type_Of(X,twoDCartesianDataPlot), graphX(A,Y), type_Of(Y,time), graphY(A,Z), is_A(Z,temperature). /* Definition of a temperature graph with degrees Celcius. degreeCTemperatureGraph(A):-temperatureGraph(A),graphY(A,c). Temperature Graph Model
/* Specifies a XY graph with Minutes on X-axis and /* F-degrees temperature on Y-axsis. graph(minutes_F). graphType(minutes_F, xyPlot). graphX(minutes_F,minutes). graphY(minutes_F,f). /* Specifies a XY graph with Minutes on X-axis and /* C-degrees temperature on Y-axsis. graph(minutes_C). graphType(minutes_C,xyPlot). graphX(minutes_C,minutes). graphY(minutes_C,c). /* Specifies a XY graph with Hours on X-axis and /* Kilometers on Y-axsis. grapth(minutes_km). graphType(minutes_km,xyPlot). graphX(minutes_km,hours). graphY(minutes_km,km). Coded Temperature Graphs
Temperature Graphs Queries /* Queries for generic temperature graphs and Degree Celcius graph. ?- temperatureGraph(X). ?- degreeCTemperatureGraph(X).
Execution of the Queries // JIPTerm query = this.addQuery("?- heavy(a)."); engine.addEventListener(jipe); engine.setTrace(true); JIPTerm[] queries = new JIPTerm[3]; // queries[1] = (JIPTerm)jipe.termParser.parseTerm("?- heavy(X)."); // queries[0] = (JIPTerm)jipe.termParser.parseTerm("?- temperatureGraph(X)."); // queries[0] = (JIPTerm)jipe.termParser.parseTerm("?- type_Of(X,time)."); queries[0] = (JIPTerm)jipe.termParser.parseTerm("?- degreeCTemperatureGraph(X)."); for (int i = 0; (i < queries.length) && (queries[i] != null); i++) { synchronized(engine) { int nQueryHandle; nQueryHandle = engine.openQuery(queries[i]); } }