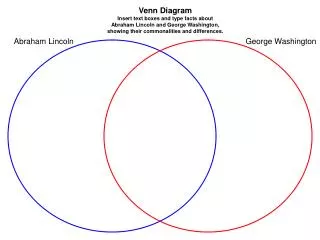
Understanding Venn Diagram
60 likes | 335 Views
Understanding Venn Diagram. Created by E.G. Gascon. Survey Says . A survey is taken and people are asked to check the boxes I like: Vanilla Chocolate Strawberry Ice cream. They may check one, two or three boxes.

Understanding Venn Diagram
E N D
Presentation Transcript
UnderstandingVenn Diagram Created by E.G. Gascon
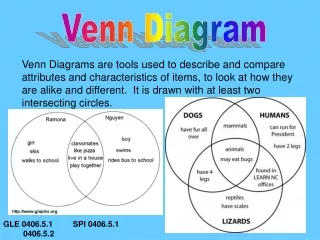
Survey Says • A survey is taken and people are asked to check the boxes • I like: • Vanilla • Chocolate • Strawberry Ice cream. They may check one, two or three boxes. If you are told that 100 people like vanilla, does that mean that they do not like chocolate or strawberry. No : because they could check all three boxes if they wanted to .
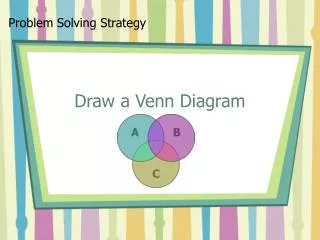
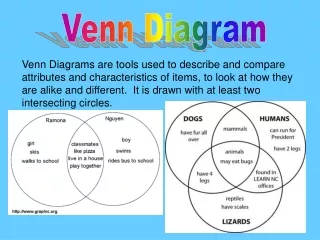
Picture the survey • Where • circle A represent the people who like vanilla • Circle B represent the people who like chocolate • Circle C represents the people who like strawberry. • Notice that the circles overlap • Because : people could check one, two, or three boxes.
What do the circles mean? For example: Circle A – is made up of 4 parts A only + (A & B) + (A & C) + (A & B & C) If A rep all who like vanilla, B rep all who like chocolate, and C rep all who like strawberry ice cream , then: A only will be those who like vanilla but not chocolate nor strawberry. A & B will be those who like vanilla and chocolate, but not strawberry A & C will be those who like vanilla and strawberry but not chocolate A & B & C will be those who when they have a half gallon of Neapolitan ice cream will take a little of each because they like them all. If we say that there are 100 people who like vanilla, they could like vanilla only, vanilla and chocolate, vanilla and strawberry, or vanilla , chocolate and strawberry.
What do the circles mean? In a like manner: Circle B – is made up of 4 parts B only + (A & B) + (B & C) + (A & B & C) If B rep all who like vanilla, B rep all who like chocolate, and C rep all who like strawberry ice cream , then: B only will be those who like chocolate but not vanilla nor strawberry. A & B will be those who like vanilla and chocolate, but not strawberry B & C will be those who like chocolate and strawberry but not vanilla A & B & C will be those who when they have a half gallon of Neapolitan ice cream will take a little of each because they like them all. If we say that there are 100 people who like chocolate, they could like chocolate only, vanilla and chocolate, chocolate and strawberry, or vanilla , chocolate and strawberry.
Lets look at the Vanilla lovers only • Of the 100 who like vanilla there could be 50 who like vanilla and chocolate and 15 who like vanilla and strawberry. • But of those 50 there may be 10 who are considered to like all three (they checked all three boxes) • So working from the inside – out we write a 10 in the area for all three • That leaves 5 (15 – 10) who really only like the two kinds vanilla and strawberry (note: the area enclosed by circle A and circle C sums to 15) • On the other side there are 40 (50 -10) who like the two kinds vanilla and chocolate (note: the area enclosed by circle A and circle B sums to 50 • Next the questions is how many really only like vanilla and NOT (chocolate or Strawberry) That will be the number left of the 100 that said they like vanilla. (100 – (5 + 10 + 40) or 45 • If you add all the numbers in circle A 45+40+10+5 the sum is 100.