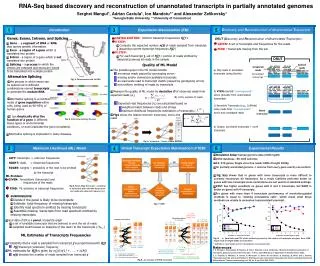
Maximum Likelihood And Expectation Maximization
Maximum Likelihood And Expectation Maximization. Lecture Notes for CMPUT 466/551 Nilanjan Ray. MLE and EM. Maximum Likelihood Estimation (MLE) and Expectation Maximization are two very important tools in Machine Learning

Maximum Likelihood And Expectation Maximization
E N D
Presentation Transcript
Maximum Likelihood And Expectation Maximization Lecture Notes for CMPUT 466/551 Nilanjan Ray
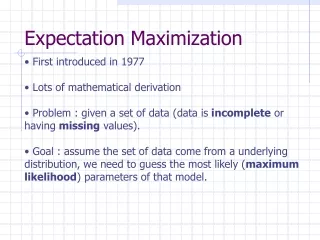
MLE and EM • Maximum Likelihood Estimation (MLE) and Expectation Maximization are two very important tools in Machine Learning • Essentially you use them in estimating probability distributions in a learning algorithm; we have already seen one such example– in logistic regression we used MLE • We will revisit MLE here, realize certain difficulties of MLE • Then Expectation Maximization (EM) will rescue us
Probability Density Estimation: Quick Points Two different routes: • Parametric • Provide a parametrized class of density functions • Tools: • Maximum likelihood estimation • Expectation Maximization • Sampling techniques • …. • Non-Parametric • Density is modeled by samples: • Tools: • Kernel Methods • Sampling techniques • …
Revisiting Maximum Likelihood The data is coming from a known probability distribution The probability distribution has some parameters that are unknown to you Example: data is distributed as Gaussian yi~ N(, 2), so the unknown parameters here are = (, 2) MLE is a tool that estimates the unknown parameters of the probability distribution from data
MLE: Recapitulation • Assume observation data yiare independent • Form the Likelihood: • Form the Log-likelihood: • To find out the unknown parameter values, maximize the log-likelihood with respect to the unknown parameters:
MLE: A Challenging Example Source: Department of Statistics, CMU Observation data: histogram Indicator variable Mixture model: is the probability with which the observation is chosen from density 2 (1- ) is the probability with which the observation is chosen from density 1
MLE: A Challenging Example… Maximum likelihood fitting for parameters: Numerically (and of course analytically, too) Challenging to solve!!
Expectation Maximization: A Rescuer EM augments the data space– assumes some latent data Source: Department of Statistics, CMU
EM: A Rescuer… Maximizing this form of log-likelihood is now tractable Note that we cannotanalytically maximize this log-likelihood Source: Department of Statistics, CMU
EM: The Complete Data Likelihood By simple differentiations we have: So, maximization of the complete data likelihood is much easier! How do we get the latent variables?
Obtaining Latent Variables The latent variables are computed as expected values given the data and parameters: Apply Bayes’ rule:
EM for Two-component Gaussian Mixture • Initialize 1, 1, 2, 2, • Iterate until convergence • Expectation of latent variables • Maximization for finding parameters
EM for Mixture of K Gaussians • Initialize mean vectors, covariance matrices, and mixing probabilities: k, k, k, k =1,2,…,K. • Expectation Step: compute responsibilities • Maximization Step: update parameters • Iterate Steps Expectation and Maximization until convergence
EM Algorithm in General T = (Z, Zm) is the complete data; we only know Z, Zm is missing Taking logarithm: Because we have access to previous parameter values , we can do better: Let us now consider the expression: It can be shown that This is actually done by Jensen’s inequality Thus if ’ maximizes then
EM Algorithm in General • Start with initial parameter values (0); t = 1 • Expectation step: compute • Maximization step: • t =t + 1 and iterate
EM Algorithm: Summary • Augment the original data space by latent/hidden/missing data • Frame a suitable probability model for the augmented data space • In EM iterations, first assume initial values for the parameters • Iterate the Expectation and the Maximization steps • In the Expectation step, find the expected values of the latent variables (here you need to use the current parameter values) • In the Maximization step, first plug in the expected values of the latent variables in the log-likelihood of the augmented data. Then maximize this log-likelihood to reevaluate the parameters • Iterate last two steps until convergence
Applications of EM • Mixture models • HMMs • PCA • Latent variable models • Missing data problems • many computer vision problems • …
References • The EM Algorithm and Extensions by Geoffrey J. MacLauchlan, Thriyambakam Krishnan • For a non-parametric density estimate by EM look at: http://bioinformatics.uchc.edu/LectureNotes_2006/Tools_EM_SA_2006_files/frame.htm
EM: Important Issues • Is the convergence of the algorithm guaranteed? • Does the outcome of EM depend on the initial choice of the parameter values? • How about the speed of convergence? • How easy or difficult could it be to compute the expected values of the latent variables?