Download
1 / 3
30 likes | 158 Views
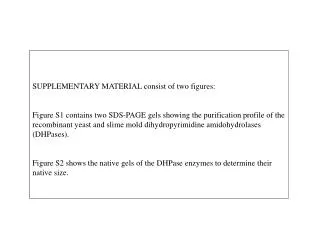
SUPPLEMENTARY MATERIAL consist of two figures: Figure S1 contains two SDS-PAGE gels showing the purification profile of the recombinant yeast and slime mold dihydropyrimidine amidohydrolases (DHPases) . Figure S2 shows the native gels of the DHPase enzymes to determine their native size. kDa.

E N D
SUPPLEMENTARY MATERIAL consist of two figures: Figure S1 contains two SDS-PAGE gels showing the purification profile of the recombinant yeast and slime mold dihydropyrimidine amidohydrolases (DHPases). Figure S2 shows the native gels of the DHPase enzymes to determine their native size.
kDa kDa 100 100 60 60 50 50 40 40 20 20 15 15 10 10 1 2 3 4 5 6 7 8 9 10 1 2 3 4 5 6 7 8 9 10 D. discoideum DHPases S. kluyveri DHPases Figure S1 Top Bottom Expression profile of yeast and slime mold dihydropyrimidine amidohydrolases (DHPases). For recombinant enzyme expression E. coli, transformed with a plasmid coding for yeast or slime mold DHPase containing the C-terminal (His)8 tag,was induced for 24 hours and the cells harvested. The collected cells were disrupted and the supernatant applied to Ni2+-NTA column. The recombinant DHPases were eluted with a linear gradient of 50 – 500 mM imidazole (further details can be found in Materials and Methods). Proteins originating from different purification steps were separated on SDS-PAGE gels: (1) BenchMark protein ladder standard (from Gibco BRL / Life Technologies), (2) E.coli extract prior to induction, (3) overnight culture of E. coli upon induction, (4) first eluate from the Ni2+-NTA column, (5 – 10) active fractions from the column after elution with imidazole.
Top Bottom 1 2 3 4 5 6 1 2 3 4 5 6 1 2 3 4 5 6 1 - 2 3 4 5 6 4% 6% 8% 10% Figure S2 The mass of the native proteins was determined by native gel electrophoresis on 4 – 10 % gradient gels in Tris-glycine buffer, pH 8.5 in a GibcoBRL Mini-V 8 X 10 vertical gel electrophoresis system. Gels were stained with Coomassie Blue. The following samples were loaded at the “Top”: (1) urease with trimer of 272 kDa and hexamer of 545 kDa, (2) bovine serum albumin with monomer of 66 kDa and dimer of 132 kDa, (3) chicken egg albumin of 45 kDa, (4) carbonic anhydrase of 29 kDa, (5) S. kluyveri DHPase, and (6) slime mold DHPase. The native size was determined as recommended by the nondenatured protein molecular weight marker kit producer (Sigma; Sigma Tech. Bulletin N. MKR-137, October 1986: p.1-8). The procedure for determining molecular weights of nondenatured proteins was a modification of the methods of Bryan (Bryan JK, 1977, Anal. Biochem. 78: 513) and Davis (Davis BJ, 1964, Ann. NY Acad. Sci. 121: 404).