The Critical Role of Forests in Climate Change Mitigation and Ecosystem Services
This document discusses the vital connection between forests and climate stability, highlighting that forests cover 25-30% of the global land area and are crucial for water quality, wildlife, and recreation. It notes the alarming rate of deforestation, particularly in the U.S., and the dire implications of climate change, including greenhouse gas emissions and changing ecosystems. The paper emphasizes the necessity for adaptive forest management that considers various factors like carbon, albedo, and water balance, and suggests that forests are integral to mitigating climate change impacts.

The Critical Role of Forests in Climate Change Mitigation and Ecosystem Services
E N D
Presentation Transcript
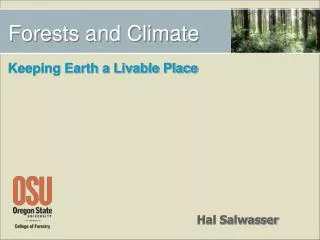
Forests and Climate Keeping Earth a Livable Place Hal Salwasser July 2008
Keystone ecosystems for a livable earth: 25-30% of current global land cover; 33% of US (~750 M acres), 45% of OR (~28 M acres) Forests for quality of life: water, wood, fish, wildlife, jobs, wealth creation, recreation, culture, ecosystem services Losing forests globally to other land uses; ~ 50% since agriculture; US loses ~ 1M acres/year Why Forests?
Context for local livability, varies widely around the globe Always changing, but not same change everywhere Current rapid warming, especially higher latitudes: unequivocal (IPCC 2007), but there are skeptics Humans augmenting “natural” radiative forcing thru green house gas (GHG) emissions past 150 years: very high confidence (IPCC 2007), but … Human induced CO2 to atmosphere believed to be at highest rate since Paleocene-Eocene Thermal Maximum, ~ 56 M years ago, a time of massive marine extinctions, emergence of modern mammal taxa, and ~ 20oF warmer than present Why Climate?
CO2 Links Forests and Climate: (but not only link) Plants use CO2 + H2O + solar energy to “grow” (photosynthesis) CO2 is a GHG Photosynthesis and growth transfer carbon from atmosphere to vegetation and soils, release O2 C sequestered and stored in Oregon forests and products = ~ 51% of C emitted from burning fossil fuels in Oregon each year Why Forests and Climate?
Energy Absorption, Reflectance (Albedo) Darker land cover, e.g., conifers, absorbs energy/heat -- warmer Lighter land cover, e.g., snow, reflects energy back to atmosphere -- cooler Water Balance, Evaporative Cooling Evapotranspiration works like a swamp cooler Clouds created by transpiration block incoming radiant energy, cool Other Forest-Climate Links
Searching for Truth Additionality Milankovitch Arrhenius Scenarios Adaptation Eccentricity Albedo Mitigation Bali IPCC GHG Gore C Credits Offsets Kyoto Proxy Data Obliquity Climate Audit.org RealClimate.org Cap and Trade CCAR Axial Precession
Fig. 2. The current generation of climate models treats the biosphere and atmosphere as a coupled system G. B. Bonan Science 320, 1444 -1449 (2008) Published by AAAS
Fig. 1. Biogeochemical (carbon) and biogeophysical (albedo and evapotranspiration) processes by which terrestrial ecosystems affect climate (SOM) G. B. Bonan Science 320, 1444 -1449 (2008) Published by AAAS
Fig. 3. Climate services in (A) tropical, (B) temperate, and (C) boreal forests G. B. Bonan Science 320, 1444 -1449 (2008) Published by AAAS
Climate is Always Changing Human actions may/can/are modifying effects of natural forces of change Change will create “winners” and “losers” Forests are a Major Part of Earth’s Climate System They are also changing as their plants and animals adapt to change Forests and forest products can be used to partially mitigate some GHG emissions, e.g., offsets Future forest management must be dynamic, adaptive to change regardless of its causes; must address C, albedo, and water Policy Proposalsdo notAdequately Consider Forests Major focus on GHG only, ignore albedo and water interactions Kyoto credits afforestation only S 2191 in Congress begins to address forests, not products Bali adds avoided deforestation, nothing else on forests or products Key Messages
Change over Time Glacial-interglacial change (~ 40-50X in past 2.7 million years) • < 3,000’ elevation change in species’ ranges • < 1,000 miles latitude change in species’ ranges • Repeating cycles of deforestation/afforestation • Species continually moving, ecosystems reassembling • Continual adaptation, extirpation, evolution, some extinctions • Very little human influence on climate till ~ 10,000 ybp • Accelerated extirpation/extinction due to harvest and habitat conversion by modern humans Post-glacial change (last 10,000 years) • Smaller climate changes; Younger Dryas, Medieval Warm, Little Ice Age • Natural disturbances: fires, floods, storms, volcanoes • Increasing human impacts: fires, harvest, species alterations, land-use conversion, restoration, air/water pollution
Forest Change ~ 50% global loss since 10,000 ybp, most in temperate regions 2000-2005: - 18 million ac/yr; - 32 tropics, + 14 non-tropics UN FAO 2005
Climate Change Instrumental record, direct temperature measurements Proxy data in blue from ~ 60 tree ring histories. Tree ring widths do not reflect temperature only.
How much solar energy reaches Earth’s surface Varies with how close Earth is to sun in orbital cycles Shape of orbit, tilt of axis, precession, wobble Varies with solar activity -- very high last 60 years Varies with atmospheric composition Especially important is summer energy to northern hemisphere – melts snow and ice How energy/heat moves through ocean currents/atmosphere How much radiant energy is “trapped” by atmosphere Greenhouse effect of certain gases: H2O, CO2, CH4, N2O, CFHCs (CO2 is not the most potent GHG) CO2 = ~ 55-60% change in radiation balance, CH4 = ~ 20% Varies with human activities: GHG emissions, albedo, water balance Climate is About Energy
Orbital Climate Factors The major cyclical, factors that trigger glacial/interglacial cycles but do not uniquely drive them. Cycles within cycles within cycles within cycles … regardless of human actions. Intensification of northern hemisphere glaciation ~ 2.5 M ybp involves complex feedbacks; Earth has been this cold only ~ 5% of its history.
Other Climate Factors Solar activity– 11-year sunspot cycle; non-linear driver of smaller changes within longer cycles; radiative variability cycle to cycle Ocean/wind current fluctuations (Panama, PDO, NAO, ENSO, others) Mountain uplift, e.g., Himalaya, Cascades, Sierra Nevada Albedo, water balance Volcanoes – short-term cooling, SO4, particulates Large fires – short-term cooling from particulates; long-term warming from CO2 released; albedo, water balance change Big storms – Katrina will release CO2 = annual U.S. forest uptake Human activities: deforestation, agriculture/livestock (CH4, N2O), burning organic carbon (wood, peat, coal, oil, gas), burning inorganic carbon (cement), industrial chemicals, land use change on albedo, water How and how much do human activities interact with “natural” climate factors?
Future Based on Orbital Variations Imbrie and Imbrie (1980). Science: long-term cooling trend began some 6,000 years ago, will extend for next 23,000 years Berger and Loutre (2002) Science: current warm climate may last another 50,000 years. Most, but not all, prior warming periods (interglacials and interstadials) appear to have been cooler than present and lasted shorter than colder periods (glacials and stadials)
Ruddiman’s Hypothesis W. F. Ruddiman (2006). Plows, plagues and petroleum: how humans took control of the climate. Princeton Univ. Press
Human Factor over Time • ~ 1 - 2 mya: H. erectus “invades” Eurasia from Africa; ~ 8- 10 major glacials back; small hunter-gatherer bands; tool maker; used fire to cook and shape landscapes by ~ 250 K ybp; used watercraft?, est. pop. ~ 10 K • ~ 150 kya: H. sapiens present in all of Africa; used fire; made tools; hunter-gatherer social groups; est. pop. ~ 1-2 M • ~ 70 K-60 kya: H. sapiens “invades” Eurasia, then Australia; middle of most recent glacial; replace/ assimilate Neanderthals in Eurasia by ~ 30,000 ybp; est. pop. ~ 4-5 M • “Nature” in full control of climate
Human Factor over Time • ~ 15 kya: Americas colonized from Beringian source pop.; at southern tip of SA by 13-12 kya; est. world pop. ~ 7-8 M • ~ 12 kya: agriculture appears in Fertile Crescent, Yellow River, Indus, Mesoamerica later; allows more pop. growth; forest conversion spreads; warm Earth; est. pop. ~ 10 M; 1st atmospheric CO2 anomaly? (Ruddiman) • ~ 5 kya: paddy rice cultivation; est. pop. < 100 M; CH4 anomaly? • 5-3 kya: bronze/iron ages; wood for fuel; more forest conversion for farms; est. pop. > 100 M; 2nd CO2 anomaly?
Human Factor over Time • Middle ages: plagues, some forest recovery; est. pop. ~ 300 M;atmospheric CO2 drop? • 1850: surge in use of fossil fuels for energy; more deforestation; est. pop. ~ 1.2 B, 1 B in India, China, Europe;largest GHG anomalies begin • 1950s: Europe, U.S., Japan economies take off; forest recovery in advanced countries; est. pop. ~ 3 B • 1990s: India and China begin rapid economic growth using coal- fired energy; est. pop. ~ 6 B • Today: India, China booming; pop. > 6.6 B, still growing • Humans in control of climate?
Carbon and Climate over Time: Only Part of the Story Atmospheric CO2correlateswith temperature • ~ 180-200 parts per million carbon (ppmc) during glacial maxima • ~ 280 ppmc during interglacial periods, e.g., 1750 • MGST was –10o F, 18 kya; last glacial maximum 381 ppmc in atmosphere in 2006 (0.038% CO2) • Highest level in at least 800 K years (ice cores) • MGST +1o F since 1900; why not higher if CO2 drives temp? why CO2 so high if temp drives? lag effects, feedbacks, imperfect science • Fastest increase detected/recorded (under debate) • Average annual CO2 emissions from burning hydrocarbons = ~ 6.4 gigatonnes (GtC) in 1990s (range 6-6.8) = ~ 7.2 GtC in 2000s (range 6.9-7.5) (1 GtC = 1 Billion metric tons = 1 PgC)
CO2 Trends Over Time Vostok is Antarctica ice cores
How Much Carbon? Atmospheric pool*~ 800 GtC in 2007 (~ 580 GtC in 1700) Terrestrial ecosystem pool*~ 2,050 GtC • Forest ecosystem pool ~ 1,000 GtC • ~ 10-20% of carbon in fossil fuel pool 5,000-10,000 GtC in hydrocarbon pool* ~ 38,000 GtC in oceanic pool 65,000,000 – 100,000,000 GtC in carbonaceous rocks * = Most active in annual fluxes Houghton (2007) Annu. Rev. Earth Planet Sci.
Carbon Transfers - Past • Fossil fuel burning and cement making from 1850- 2006 transferred ~ 330 GtC from hydrocarbon and carbonaceous rock pools to atmosphere • ave. ~ 2.1 GtC/yr, but accelerating from slow start • Land-use change from 1850-2006 transferred ~156 GtC from ecosystems to atmosphere • ave. ~ 1 GtC/yr, but now at 1.5 GtC/yr • 90% from deforestation www.globalcarbonproject.com
GHGs Not All Fossil Fuels! Land use change Fossil fuels
Carbon Transfers - Now Annual transfers to atmosphere: • Soil organic oxidation/decomposition ~ 58 GtC* • Respiration from organisms ~ 59 GtC • Hydrocarbon burning, cement ~ 8.4 GtC (2006) • 85% less than soil transfers • Land-use change ~ 1.5 GtC • 18% as much as hydrocarbon, cement transfer • high uncertainty though, range 0.5-2.7 * Direct relationship with temperature Houghton (2007), www.globalcarbonproject.com
Carbon Transfers - Now Annual transfers from atmosphere: • Photosynthesis ~ 120 GtC to biosphere sinks* • Diffusion into oceans ~ 2 GtCnet Net ~ 5 GtC/yr into atmospheric accumulation • Recall 1850-2006 ave. ~ 1 GtC/yr Current biosphereandoceanuptake able to offset only ~ 55% of annual transfers to atmosphere Houghton (2007), www.globalcarbonproject.com
Global Carbon Fluxes Unidentified sink = terrestrial ecosystems. MGST on steady rise, ~ +1OF/100 years since 1800; GHG emissions most rapid increase only since post WWII.
Lifestyle Matters US DoE, Energy Information Administration (2006)
Projected CO2 Emissions US DoE Energy Information Administration (2007)
NA Carbon Budget 2003 Annual Emissions = ~ 2 GtC Fossil fuel emissions = ~ 1.9 GtC + 10%, = ~ 25% of global emissions 85% from US, 9% CN, 6% MX 42% for commercial energy 31% for transportation Annual Sinks = ~ .65 GtC (high annual variability, growth, fires) Growing veg = ~ .5 GtC sink + 50%, 50% from forest growth US forests = ~ .25 GtC sink NA sinks important but not capable of fully offsetting current NA emissions Net = ~ + 1.35 GtC + 25% CCSP (2007)
IPCC Future Scenarios S-I. Akasofu (2008) suggests data show only ~ +1oF/100 years MGST since 1800, “natural” recovery from LIA, future should not assume any larger temp change. R.A. Pielke, Sr. (2008) argues we should be using ocean heat change; it is less than global surface temperature change and more important to local and regional climate change.
If Warming: Impacts Milder winters, hotter summers (regionally variable) • More ppt as rain than snow, increased drought stress, less summer rain Declines in water supply • Earlier peak flows, lower summer flows, hydro-fish conflicts, low water on summer ranges Altered growing seasons; esp. @ high latitudes • Longer growing seasons but less soil moisture, shift in growing zones, farm crops shift, tundra thaws More wildland fires, bigger, more intense Bad air • Heat waves, pollutants from coal-fired plants, automotive emissions, particulates from wildland fires
If Warming: Impacts Salmon declines • Migration timing impacts, summer water temp higher, algal blooms, ocean conditions North polar ice melt • Sea level rise, northern passage open? (first since 1400s) Wildlife: Some Winners, Some Losers • Losers: specialists unable to adjust to habitat changes • Winners: invasives, generalists that can adapt Pest infestations • Warmer winters = fewer pest die offs; longer reproduction period = “explosive natives,” e.g., MPB
Changing Course onCO2 is Possible BAU All Wedges Working After Pacala and Socolow (2004)
Is it Feasible/Desirable? • Is it feasible given India, China, Brazil? • Other human activities may =/>GHG effects, e.g., alterations in land surface characteristics – albedo, water balance • Long-term, major cyclical forces will eventually take Earth back to another ice age (Ruddiman: says it should have started 4-6 K years ago. Is human action why not? Others suggest not for another 1- 2 K years, yet others 50 K years.) • Could/are GHGs counter the orbital/solar/ocean/earth surface drivers of climate change that will eventually send the planet back to the next glacial period? • What are downsides of enacting policies to reduce GHG if it turns out other factors are more important to climate change?
The Wedges Strategy • End-user energy efficiency and conservation, i.e., do more using less hydrocarbon fuel • Power generation efficiencies, less carbon intensive • Carbon Capture and Storage at energy plants • Non-hydrocarbon energy sources: solar, wind, wave, nuclear, renewables – more carbohydrate fuel • Agriculture and forests Pacala and Socolow (2004), Socolow and Pacala (2006)
Hard Questions • How direct is current cause-effect link between GHG--climate: is CO2 driving temperature or is temperature driving CO2? • How effective could each wedge be in changing current trends if that is desired? • Which wedges would deliver “biggest bang for $$?” • Which wedges would be highest cost per unit outcome? • Why is so much attention on small sources of CO2 (8.4, 1.5)? Cost/ton? • What is possible for photosynthesis and oxidation (120, 58)? • If avoiding cold becomes desirable, could/would world change thinking and actions quickly enough? • How can science about climate be parsed from interest-based politics: what is really known vs. what model results serve interest-based political agendas; daylight major uncertainties? • Unintended consequences of bad policy, e.g., fuel from food?
Forest “Wedge” Components • Halt, reverse deforestation, land-use conversion trends; “compensated reduction” through carbon markets* • Reduces forest-based emissions, maintains storage capacity • Increase forested area, i.e., afforestation (some debate about northern latitude albedo)* • Increases sequestration/storage capacity • Manage forests to store more carbon over long term, increase resilience to drought, insects, fires* • Both increases sequestration and storage and reduces emissions • Reduce energy use in forest management, harvest, transport, reforestation • Reduces emissions from fossil fuel used * Proposed in S. 2191
Capture more tree carbon in durable wood products Extends “life” of stored tree carbon Use wood products instead of energy demanding, higher polluting substitutes, e.g., steel, concrete, plastics Avoids carbon emissions from materials production Use mill waste, woody biomass, consumer waste for bio- based, renewable, domestic energy and bio-chemicals* Avoids carbon emissions from energy production Create sustainable incentives to stimulate the above, remove disincentives Avoids policy perversions from subsidies Forest “Wedge” Components * Proposed in S. 2191
Rotation Impacts Wedge 3
Fires and Carbon • Area and intensity of wildland fire increase with warming climate • Potential to reduce fire impacts through forest management • Transfer carbon from thinned trees to durable products or bio-based energy • CO2 released immediately during fire, less if low-intensity fire, ~ 50% if O and A soil horizons burn, blow away, e.g., Biscuit (high) • CO2 released slowly following fire; ultimate fate depends on actions, decomposition rate, products • CO2 uptake as new forest grows; how fast varies with vegetation development and management Wedges 3 and 5
Forests Plus Products Plus Displaced Energy Wedges 5 and 6
Diversifying Markets Wedge 8
Problems withEmerging Policies Driven more by power politics and fear of the future than by scientific realism and adaptive mentality Obsessed with GHGs, ignoring other significant climate factors Excessive focus on smaller GHG fluxes How baselines and “business as usual” are set; discounts C already stored, penalizes “good” actors Concepts of additionality, permanence, leakage in flux – fundamentals of Kyoto, emerging state/federal policies Ignore forest products as storage, offsets, substitutes Where the $$$ come from to change behaviors Social justice issues
A Proactive Forest Strategy Create new revenue streams and markets for forest goods and services – keeps more forestland in forest uses Advocate for “green-product” preferences in general – wood products and sustainable forestry that produces them while protecting water and native plants and animals have a “natural” market advantage Market the competitive advantages of wood products over other materials in “green” future Improve the productivity of forests sustainably managed for wood products – get more wood from fewer acres, focusing commodity wood supply on sustainably managed, high-yield forests