Download
1 / 60
600 likes | 700 Views
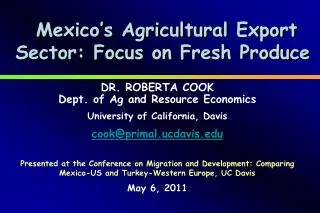
Mexico’s Agricultural Export Sector: Focus on Fresh Produce. DR. ROBERTA COOK Dept. of Ag and Resource Economics University of California, Davis cook@primal.ucdavis.edu Presented at the Conference on Migration and Development: Comparing Mexico-US and Turkey-Western Europe, UC Davis

E N D
Mexico’s Agricultural Export Sector: Focus on Fresh Produce DR. ROBERTA COOKDept. of Ag and Resource Economics University of California, Davis cook@primal.ucdavis.edu Presented at the Conference on Migration and Development: Comparing Mexico-US and Turkey-Western Europe, UC Davis May 6, 2011
Overview • Basics, framing the industry and the issues • Understanding the forces behind the U.S.-Mexico fruit and veg trading relationship – fresh veg trade is mainly intra-NAFTA • U.S. consumption and supply trends for some key fruit and veg • Changes in US fresh produce imports from Mexico - pre-Nafta to the present, markets are increasingly integrated • Case studies: protected culture and tomatoes; and berries • Mexican domestic fruit and veg demand and changing market structure • Conclusions
Agricultural Harvested Area in Mexico, by Key Sector, 2008, 20.5 Million Hectares Total Source: Evolucion de la OfertaHorticola en Mexico, 1989-2009, CAADES
Agricultural Production Value in Mexico, by Key Sector, 2008, 306 Million Pesos Total Source: Evolucion de la OfertaHorticola en Mexico, 1989-2009, CAADES
Some Basics • Fresh produce trade patterns are largely determined by seasonality and ideal growing locations by season by product. • Fresh produce is generally harvested and shipped daily and daily changes in weather can affect both supply and demand, making markets very volatile; combined with high production costs markets are very risky and prices may not always cover total costs – requires substantial capitalization to withstand low markets. • Fresh produce items are consumer-ready products, directly impacted by food marketing trends. • Structural change in N. American markets is impacting demand, production, procurement practices, marketing channels and the importance of marketing services. • The 23 largest U.S. grocery buyers now control around 72% of U.S. grocery sales. • Scale is increasingly important to competitive wherewithal. California firms dominate. • Large retail and foodservice buyers demand year-round supply, increasingly provided by U.S. grower-shippers which import during the off-season, including from Mexico. Large Mexican growers that export (grower-exporters) have generally not been able to put together yr-round deals themselves.
Forces Behind U.S. Imports of Fresh Produce from Mexico • In 2010 Mexico supplied 68% of U.S. fresh vegetable and 27% of fresh fruit imports ($6 billion total value). Mexico’s small share of fruit imports is partly due to virtual non-participation in banana trade. • Mexico is a powerhouse fresh fruit and veg exporter; 2010 export fruit value was $2.339B plus $4.310B veg exports to the world ($6.649B total). • The U.S. is the predominant market for Mexican fresh and process fruits and veg (importing an average of 83% of Mexican fruit exports and 91% of veg exports in 2008-10). • Like the U.S., Mexico is generally not competitive in the EU market for most crops (avocados a major exception for Mexico). • Mexico does not have internationally competitive production of oranges and grapefruit and hence the U.S. still dominates in this trade to Asia. • Mexico is attempting to better access the Asian market as a diversification strategy but the U.S. will remain the principal market due to proximity and high demand. • About 26% of Mexico’s production of fresh produce is estimated to be exported (v. 15% pre-NAFTA) – most production is still for domestic use. • Hence, employment and revenue in the Mexican hort. sector is first dependent on trends in Mexican consumption (110 million inhabitants); then on U.S. demand.
Forces Behind U.S. Imports of Fresh Produce from Mexico • Most of our fruit and veg imports from Mexico are in fresh form. There is also a frozen broccoli, cauliflower and strawberry export industry. • Seasonality drives shipments and trade in fresh produce and Mexico has always had and will have climatic advantages making it a critical player in U.S. fresh produce supply. This will not change. • The U.S. imports from Mexico (in declining order) because we either: • do not produce enough during certain seasons, usually the winter months • do not produce (virtually) many tropical products • do not produce enough of the product type desired in the U.S. (e.g. vine-ripe tomatoes and greenhouse vs. mature green) • have higher costs at point of shipment (FOB) or landed into specific markets. • What determines relative competitiveness is not just production costs, but also harvest, transportation, logistics/handling and marketing costs to reach specific markets – landed costs. Mexico has proximity to market vs. non-N. American producers. For fresh veg most trade is intra-NAFTA.
Forces Behind U.S. Imports of Fresh Produce from Mexico • Crops where Mexico has a landed cost advantage at the U.S. border (asparagus, green onions, radishes, cilantro) requirebunching at harvest. • These crops can be grown close to the U.S. border in Baja California and Sonora (e.g., the Mexicali-San Luis valley) and have displaced part of U.S. production. • This displacement was led by Ca. grower-shippers who control most of the production and marketing of these crops year-round regardless of production location, and has benefited both Mexico and the U.S. • For most other crops production did not shift to Mexico since NAFTA. The U.S. will always have advantages in serving its home market without trade barriers or breaking the cold chain. • Rapid growth in Mexican exports to the U.S. have been driven by growth in consumption of key crops like tomatoes and other winter veg, mangoes, grapes, avocados, and in some cases due to new crops, e.g., berries. • Hence, the export outlook for Mexico continues to largely depend on U.S. demand trends, which have been generally favorable – but crop specific.
Forces Behind U.S. Imports of Fresh Produce from Mexico • The state of Sinaloa is the largest Mexican exporter of fresh produce, followed by Baja, Sonora, central Mexico, and Michoacán for avocados; the crops grown and seasons are different in these regions and their competitive outlooks vary. • For many crops (especially fruit) the primary market is domestic while others face dual markets, and others are totally export-oriented. These factors greatly influence performance. • The leafy green sector is not an important exporter from Mexico whereas exports of 6 winter vegetables from the state of Sinaloa are: Tomatoes, bell peppers, cucumbers, eggplant, sweet corn and squash – the identical product line as in Florida – the direct competitor. CA doesn’t produce those crops during the winter. • Sinaloa’s competitive advantage is that it rarely freezes during the winter whereas the competing region in N. America, Florida, has a much higher freeze risk. In addition, it has large grower-exporters, many of which are well-capitalized, rapid technology adopters, efficient, with strong food safety programs, and several of which control their own marketing. • Food safety standards for export-oriented producers are essentially the same as in the U.S. since they must be 3rd party certified (just as U.S. growers). This is not the case for producers oriented to the domestic market. Food safety programs require significant investments and are a barrier to entry.
Key Lessons • The relative competitiveness of the U.S. industry is because more than being labor-intensive fruits and veg are information/knowledge- technology- capital- and marketing-intensive. • The U.S. has traditionally held the advantage in the latter. • However, Mexico is developing protected culture of key export crops: tomatoes, sweet peppers, and cucumbers; these are also knowledge- technology- and capital-intensive. This should continue to strengthen its competitiveness. Labor efficiency is also increasing. • U.S. grower-shippers are playing a greater role in the sourcing and marketing of Mexican fresh produce (including in some cases joint ventures in packing sheds, not just production) and some retailers are attempting to import directly, led by Walmart. This means that non-value-adding costs are gradually being driven out of the system, improving Mexico’s competitiveness. • Yet Mexico still lags in marketing and logistics; Mexican export marketing is still too fragmented, with smaller players marketing through brokers which can be disruptive to markets. • Security concerns are increasing costs and decreasing logistical efficiency.
U.S. Consumption and Supply Trends for Select Fresh Produce Items
US PER CAPITA VEGETABLE CONSUMPTION, POUNDS, 1976-2009 415.4 359 125.3 119 80.4 Pounds per capita 76 37.4 49 172.3 150 115 Source: USDA/ERS, Vegetables and Melons Situation and Outlook Yearbook, May 2010, compiled on estimated share of fresh and processed mushrooms and sweet potatoes, by Dr. Roberta Cook, UC Davis.
US Per CapitaUtilization/Consumption of FreshTomatoes(1985-2010P) Pounds per capita Source: Vegetables and Melons Situation and Outlook Yearbook, May 2010, USDA/ERS; 2008-2010 updated by ERS May 2011. P=Preliminary
U.S. Fresh Tomatoes: Production, Consumption, Imports, and Exports, 1990-2010p million tons Consumption Production Imports Exports Source: Vegetables and Melons Situation and Outlook Yearbook, May 2010, USDA/ERS; 2008-10 updated by ERS May 2011.
FreshTomato Sales in US Supermarkets: Share of Total TomatoCategory Sales, byTomatoType, in Quantity and Value, 2010 vs. 2005 vs. 1999 Type Share of Value Share of Quantity 2010 2005 1999 2010 2005 1999 Greenhouse: 43% 43% 42% 39% 41% 31% Round/beef 12 14 21 11 14 18 TOV/Cluster 31 29 21 28 27 13 Round field16 21 36 18 23 43 Roma 16 13 16 26 19 23 Snacking 26 23 6 18 17 3 Sources: CTC, IRI, and The Perishables Group*May not sum to 100 due to rounding and retailer-assigned PLU codes.
U.S. Per Capita Utilization/Consumption of Lettuce, by Type, 1985-2010F All - 28.2 4.0 Leaf 7.1 Lbs. Per Capita 17.1 2010F F=Forecast Source: Gary Lucier, USDA/ERS, September 2010
U.S. Fresh Iceberg Lettuce Market, 1960-2010Forecast: International Trade Not a Major Factor Million pounds Production Total Consumption / Utilization Imports Exports *Calif. Iceberg Lettuce Commission conducted generic promotion until March 1992. Source: USDA/ERS, U.S. Lettuce Statistics, 2011.
U.S. Fresh Romaine & Leaf Lettuce Market, 1990-2010Forecast Million pounds Total Consumption / Utilization Production Imports Exports Source: USDA/ERS, U.S. Lettuce Statistics, 2011.
U.S. Fresh Broccoli: Production, Consumption, Imports, and Exports, 1990-2010F million pounds Production Consumption Exports Imports F=forecast Source: Vegetables and Melons Situation and Outlook Yearbook, May 2010, USDA/ERS.
US Per CapitaUtilization/Consumption of SelectFreshMarket Vegetables (1985-2010F) Pounds per capita Source: Vegetables and Melons Situation and Outlook Yearbook, May 2010, USDA/ERS F=Forecast
USPER CAPITA FRUIT DISAPPERANCE/CONSUMPTION, POUNDS 1976-2009 265 255 78 100.3 93 Pounds per capita 63.4 20.7 30 80.6 55 Source: Fruit and Tree Nuts Yearbook, ERS/USDA, 11-1-10
U.S. Per Capita Consumption of Avocados and Strawberries 1985-2009, and 2010 estimate for strawberries Pounds per capita Source: Fruit and Tree Nuts Yearbook, ERS/USDA, 11-1-10; 2010 strawberry estimate by Roberta Cook.
US fresh strawberry production and trade, 1993-2010P Million lbs Production Exports Imports Sources: ERS/USDA Fruit and Tree Nut Situation and Outlook Yearbook, Oct. 2010 for production through 2007; NASS/USDA Noncitrus Fruits and Nuts Preliminary Survey, Jan. 2011 for production 2008-2010; GATS/FAS online queries for trade data.
U.S. Per Capita Consumption of Fresh Raspberries, Blackberries* and Blueberries, 1992-2010P Pounds per capita Sources: Fruit and Tree Nuts Yearbook, ERS/USDA, 11-1-10 thru 2009; preliminary estimates by Agnes Perez of ERS/USDA for 2010. *NASS/USDA does not report US production in many states and trade data are imperfect due to overlap in some berry tariff codes.
U.S. Per Capita Consumption/Utilization of Melons, by Key Type, 1985-2009 Pounds per capita Source: Fruit and Tree Nuts Yearbook, ERS/USDA, 11-1-10
U.S. Per Capita Consumption/Utilization of Select Fresh Fruit 1985-2009 Pounds per capita Source: Fruit and Tree Nuts Yearbook, ERS/USDA, 11-1-10
Changes in U.S. Fresh Produce Imports Pre-NAFTA to the Present • Caveats: • It is important to note that NAFTA was only one of many factors influencing trade patterns, and often far surpassed by other market forces. Hence, causality is not implied. • Growth in Mexican exports to the U.S. doesn’t preclude expansion in the U.S. industry as well, nor does it mean that imports from Mexico represent a high share of U.S. utilization.
US Fresh Produce Trade, $Million, 1994-2010 12.3 6.1 Source: http://www.fas.usda.gov/gats; BICO-10 $6 billion in 2010 imports from Mexico
U.S. Horticultural Imports from Mexico, in Value and Volume, 1991-93 vs. 2008-10 Value(million dollars) Volume (thousand metric tons) Crop 1991-93 2008-10 % Change 1991-93 2008-10 % Change Source: USDA/ERS Outlook, “NAFTA at 17”, March 2011.
Select U.S. Fresh Vegetable Imports from Mexico, in Value and Volume, 1991-93 vs. 2008-10 Value(million dollars) Volume (thousand metric tons) Crop 1991-93 2008-10 % Change 1991-93 2008-10 % Change Source: USDA/ERS Outlook, “NAFTA at 17”, March 2011.
Select U.S. Fresh Vegetable Imports from Mexico, in Value and Volume, 1991-93 vs. 2008-10 Value(million dollars) Volume (thousand metric tons) Crop 1991-93 2008-10 % Change 1991-93 2008-10 % Change Source: USDA/ERS Outlook, “NAFTA at 17”, March 2011.
Select US Fresh Vegetable Imports: Net Imports from the World and Mexico, Divided by U.S. Disappearance, and Per Capita Use, 19991-93 vs. 2007-09 Averages Per Capita Use (kg) From World (%) From Mexico (%) Avg AvgCommodity 1991-93 2007-09 1991-93 2007-09 1991-93 2007-09 Source: USDA/ERS Outlook, “NAFTA at 17”, March 2011.
Select Vegetable Imports: Net Imports from the World and Mexico Divided by U.S. Disappearance, and Per Capita Consumption: 1991-1993 vs. 2007-2009 Averages Per Capita Use (kg) From World (%) From Mexico (%) Avg AvgCommodity 1991-93 2007-09 1991-93 2007-09 1991-93 2007-09 Source: USDA/ERS Outlook, “NAFTA at 17”, March 2011.
U.S. Fresh Berry Imports from Mexico, in Value and Volume, 1991-93 vs. 2008-10 Value(million dollars) Volume (thousand metric tons) Crop 1991-93 2008-10 % Change 1991-93 2008-10 % Change * = Imports average less than $500,000 in value and/or less than 500 metric tons in volume. Source: USDA/ERS Outlook, “NAFTA at 17”, March 2011.
Select U.S. Fresh Fruit Imports from Mexico, in Value and Volume, 1991-93 vs. 2008-10 Value(million dollars) Volume (thousand metric tons) Crop 1991-93 2008-10 % Change 1991-93 2008-10 % Change Source: USDA/ERS Outlook, “NAFTA at 17”, March 2011.
Select U.S. Fresh Fruit Imports from Mexico, in Value and Volume, 1991-93 vs. 2008-10 Value(million dollars) Volume (thousand metric tons) Crop 1991-93 2008-10 % Change 1991-93 2008-10 % Change Source: USDA/ERS Outlook, “NAFTA at 17”, March 2011.
Select Fresh Fruit Imports: Net Imports from the World and Mexico Divided by U.S. Disappearance, and Per Capita Consumption: 1991-1993 vs. 2007-2009 Averages Per Capita Use (kg) From World (%) From Mexico (%) Fresh Avg AvgCommodity 1991-93 2007-09 1991-93 2007-09 1991-93 2007-09 Source: USDA/ERS Outlook, “NAFTA at 17”, March 2011.
Case Studies • Technology and product diversification are increasing domestic competition for the two leading tomato producer/export regions (Sinaloa and Baja California). Protected culture (PC) is a major new force for this dual market crop (export and domestic markets are both important to profitability for grower-exporters). • The development of new PC producers throughout Mexico is bringing new tomato products into the domestic market, competing both with traditional small open-field producers in central Mexico and growers in Sinaloa and Baja in their seasons. • Bushberries are a totally new export sector generating employment in central Mexico.
Advances in food safety and traceback, Harvest Mark; greenhouse tomatoes and product differentiation.
Case Studies High tech color and size sorters and automatic fill machines meets product differentiation and new product form.
Area of Protected Culture Horticultural Crops in Mexico, 1980-2009, Hectares Source: Evolucion de la OfertaHorticola en Mexico, 1989-2009, CAADES, Sept. 27, 2010
Mexican Protected Culture is Changing the N.A. Fresh Tomato Industry Initially: projects close to coastal areas, Sinaloa and Baja, “low” technology. Remember that even low-tech PC is high-tech re open-field. Later: projects moving to higher elevations. Better systems, technologies for growing: computer controls and heating and often hydroponic. Now: projects in all types of environments and with all levels of technology and progressing toward development/application of the right technology for the right location. Not there yet. Being a relatively new player, Mexico has benefited from technological advances and the experience of other areas – Spain, Netherlands, Israel, Canada, U.S. But none of these packages are a perfect fit. The learning curve is steep and ongoing with advantages for the innovators, and faster adaptation and diversification of technological alternatives than ever. PC is capital-intensive with construction costs (excl. growing costs) for basic shade houses ranging from $50,000-$88,000/hectare to $438,000 for medium-tech to $1.1 million for high-tech greenhouses. Production using protected culture substantially increases yields, quality and decreases pest/disease pressure and labor use compared to open-field production. Premium pack-out yields can be upwards of 2.5 times higher for shade houses and 10 times for high-tech greenhouses.
Mexican Protected Culture is Changing the Tomato Industry Hence, for formerly large open-field production areas like Sinaloa and Baja Ca., which are converting growing shares of their area to PC, acreage and employment is declining for any given production volume. In Sinaloa veg area declined by 23% over the last decade while production was similar. The Mexican govt. supports greenhouse construction with various financial incentives in part as a strategy to stimulate employment in areas which had limited horticultural production and little to no tomato production (e.g., in central and north central Mexico). However, the new acreage is likely insufficient to increase employment significantly in these areas. Earlier govt. interventions were ill-advised but today investment projects are larger and more market-based. The Mexican govt., simultaneously, has been working with growers in major hort. areas like Sinaloa to improve worker conditions, including through investment in housing, schools, school meals and health programs. Working conditions in PC are superior to open-field and greater worker training and skill are required. The combination of the aforementioned is reducing worker turnover for some of the Sinaloa PC growers and is mutually beneficial.
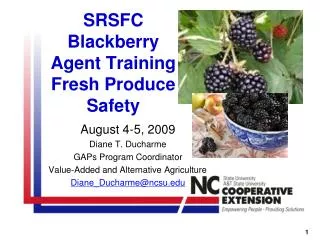
The Mexican Fresh Berry Export Sector, Mainly Bushberries The U.S. imports fresh berries because we cannot produce or do not produce enough during the winter months – not due to any cost advantages in Mexico. Major changes in fresh trade patterns include the emergence of Mexico as a replacement for Canada, Chile and Guatemala for raspberries; and Mexico’s powerhouse role in blackberries. Bushberries represent a totally new export industry for Mexico, centered in the Bajio (central Mexico), with relatively little domestic demand. Central Mexico offers proximity to the US market and temperate weather conditions year-round. Varieties focused on flavor have contributed to the growth in demand, in particular for blacks. Both the blackberry and raspberry industries were developed by foreign investment, initially from Chile for blacks and from Ca. (Driscoll) for raspberries. Ca. firms control most of the export-oriented production. Berries are highly perishable, expensive to grow, and capital-, technology-, knowhow-, and marketing-intensive. Technology, variety and other issues have limited the expansion in the strawberry industry (for exports), both in the Bajio and Baja (early spring producer). Most of Mexico’s strawberry production is for domestic consumption.